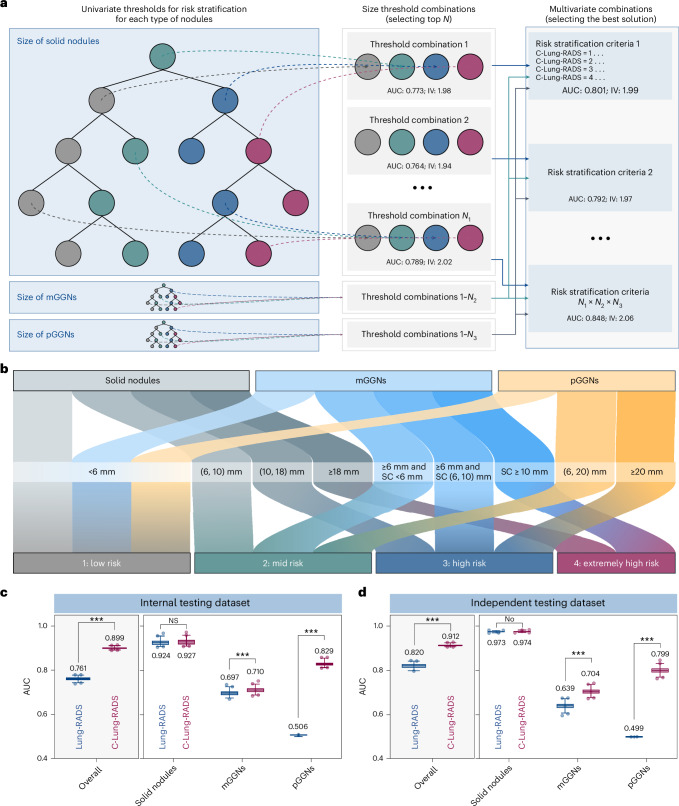
Fig. 3. A multivariate classification tree constructed for initial stratification of nodules in phase 1.
a, The process of building a multivariate classification tree, in which a grid research approach was introduced to tune parameters of the tree. b, The optimal size thresholds for three types of nodules in risk stratification (label 1: low risk; label 2: mid risk; label 3: high risk; and label 4: extremely high risk). c,d, AUC values of the classification tree used for identifying extremely high-risk nodules in the internal testing dataset (c) and the independent testing dataset (d). The AUC values are shown in box and whisker plots, in which the line and the plus sign represent the median and the mean values, respectively. The numbers in the plot are the mean AUC values. The whiskers range from the 2.5th to the 97.5th percentile, and points below and above the whiskers are drawn as individual dots. The stratification performance of the classification tree (C-Lung-RADS) was compared with Lung-RADS v2022 (based on intrinsic nodule’s density and size). Statistical analyses in c and d were performed using ordinary two-way ANOVA followed by Sidak’s multiple comparison tests, with n = 100 replicates per condition. The asterisks represent two-tailed adjusted P values, with ***P < 0.001. For solid nodules, the P values of AUC values between Lung-RADS v2022 and C-Lung-RADS in c and d were 0.163 and 0.764, respectively. NS, not significant; SC, solid component.

