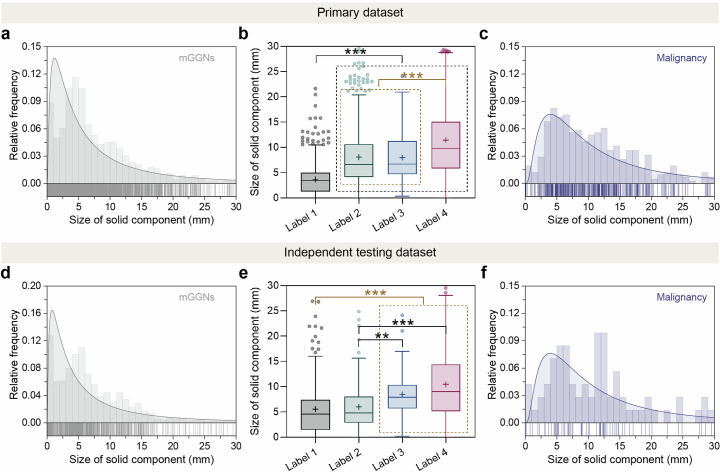
Extended Data Fig. 3. Size distribution of solid components of mGGNs in the primary dataset and independent testing dataset.
a, d, Size distribution of solid component in all mGGNs in the primary dataset and independent testing dataset, respectively (gray line, Gaussian fitting curve). b, e, Size of solid components of mGGNs with different ratings in the primary dataset and independent testing dataset, respectively. The lines and plus signs in the box-and-whisker plots represent the median and mean values, respectively. The whiskers range from 25th percentile minus 1.5 times interquartile range (IQR) to 75th percentile plus 1.5 times IQR, and outliers below and above the whiskers are drawn as individual dots. The number of mGGNs with different ratings in the primary dataset and independent testing dataset could be referred to Supplementary Table 3. Statistical analyses were performed among four categories using Kruskal-Wallis H tests followed by Dunnett’s multiple comparison tests. Asterisks represent two-tailed adjusted P value, with * indicating P < 0.05, ** indicating P < 0.01, and *** indicating P < 0.001. The P values in (b) for the size of solid component between Label 2 and Label 3 was 0.999. The P values in (e) in Label 1 vs. Label 2, Label 1 vs. Label 3, Label 1 vs. Label 4, Label 2 vs. Label 3¸ Label 2 vs. Label 4¸ Label 3 vs. Label 4 were 0.929, < 0.001, < 0.001, 0.005, < 0.001, 0.999, respectively. c, f, Size distribution of the solid component of the malignancy in mGGNs, respectively (purple line, Gaussian fitting curve).

