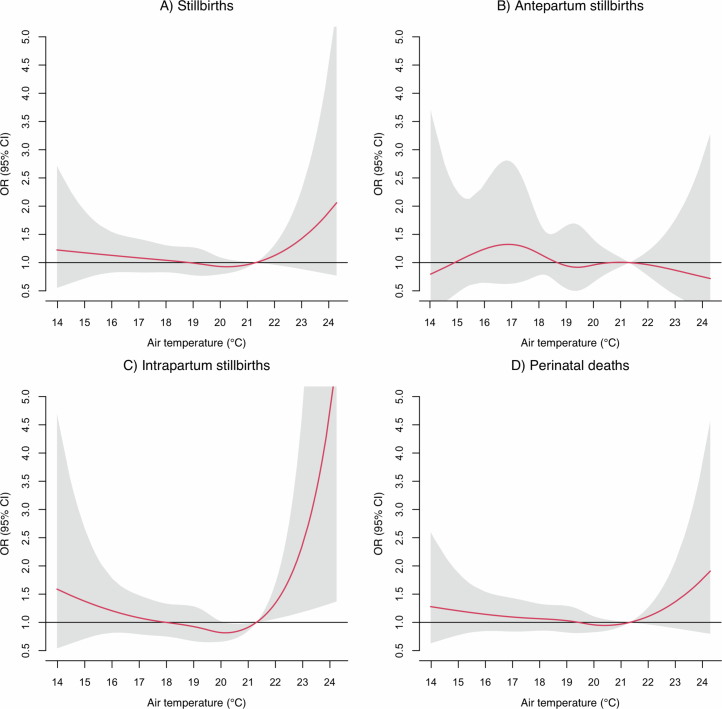
Extended Data Fig. 9. Cumulative exposure-response curve between minimum temperature the week before birth (lag 0–6) and perinatal mortality with 95%Cis.
The figure depicts the cumulative odds ratio of (a) stillbirths, (b) antepartum stillbirths, (c) intrapartum stillbirths, and (d) perinatal deaths, and 95% CIs (grey shadings). The figure represents the odds ratio of temperature against the cumulative 75th percentile of annual mean minimum temperature. The corresponding 75th temperature values of each country can be found in Supplementary Table 2.

