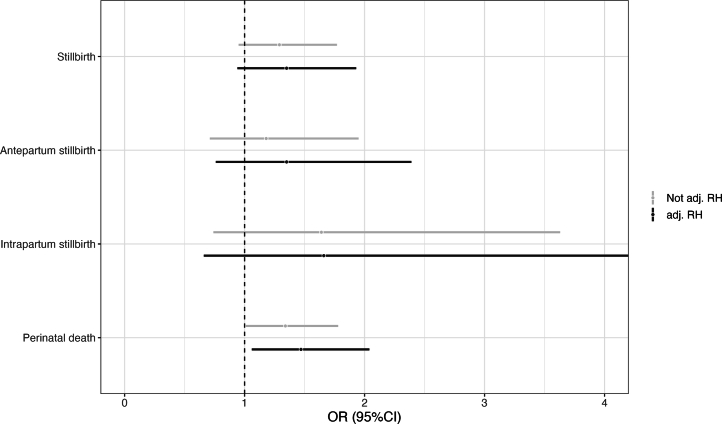
Extended Data Fig. 5. Associations between mean daily temperature the week before birth (lag 0–6) and perinatal mortality adjusted by relative humidity.
Sensitivity analysis: The figure depicts the pooled estimates adjusting (black line) and not adjusting (grey line, main approach) for relative humidity. The estimates are presented as odds ratio (OR) and 95% confidence intervals obtained from conditional logistic regression models. The estimates show the association of an increase in temperature (from the 75th to the 99th percentile) the week before birth (lag 0–6) on stillbirths, antepartum stillbirths, intrapartum stillbirths, and perinatal deaths.

