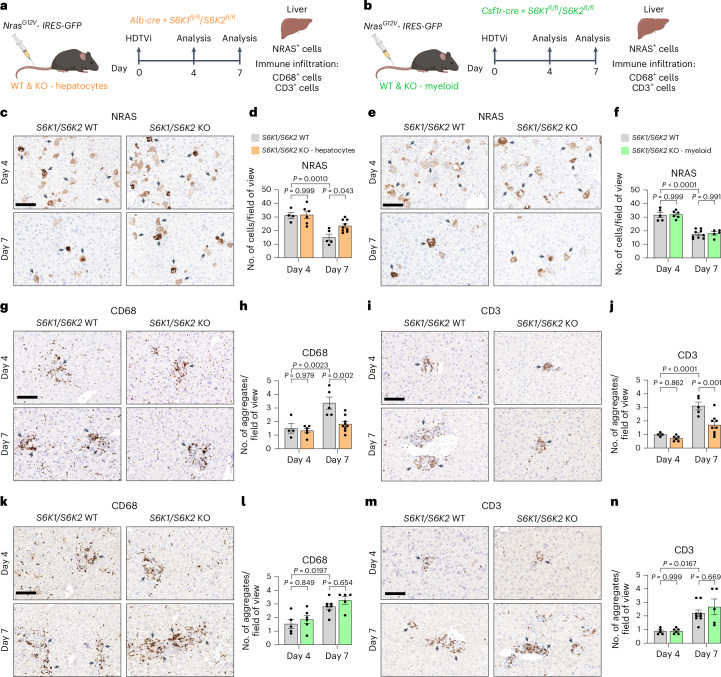
Fig. 8. Hepatocyte-intrinsic S6K signaling mediates the liver inflammatory phenotype.
a,b, Experimental scheme. HDTVi-based co-delivery of an NrasG12V transposon construct and a transposase expression vector into mouse livers (day 0). Mice were euthanized 4 d or 7 d after HDTVi to assess senescence surveillance. Hepatocyte-specific S6K1/S6K2 (a) or myeloid-specific S6K1/S6K2 (b) KO mice or the floxed controls were used. c,d, Immunohistochemistry staining for NRAS (c) and the corresponding quantification (d) of livers from hepatocyte-specific S6K1/S6K2 KO mice or the floxed controls. D4 WT (n = 4), D4 KO (n = 6), D7 WT (n = 5) and D7 KO (n = 9). e,f, Immunohistochemistry staining for NRAS (e) and the corresponding quantification (f) of livers from myeloid-specific S6K1/S6K2 KO mice or the floxed controls. D4 WT (n = 5), D4 KO (n = 6), D7 WT (n = 9) and D7 KO (n = 5). g–j, Immunohistochemistry staining for CD68 (g) or CD3 (i) and the corresponding quantification (h and j) of livers from hepatocyte-specific S6K1/S6K2 KO mice or the floxed controls. D4 WT (n = 4), D4 KO (n = 6), D7 WT (n = 5) and D7 KO (n = 9). k–n, Immunohistochemistry staining for CD68 (k) or CD3 (m) and the corresponding quantification (l and n) of livers from myeloid-specific S6K1/S6K2 KO mice or the floxed controls. l, D4 WT (n = 5), D4 KO (n = 6), D7 WT (n = 7) and D7 KO (n = 5). n, D4 WT (n = 5), D4 KO (n = 6), D7 WT (n = 9) and D7 KO (n = 5). Data are expressed as mean ± s.e.m. Statistical significance was calculated using two-way ANOVA with Tukey’s multiple comparison test. n denotes individual mice. Scale bar, 100 μm. D, day.

