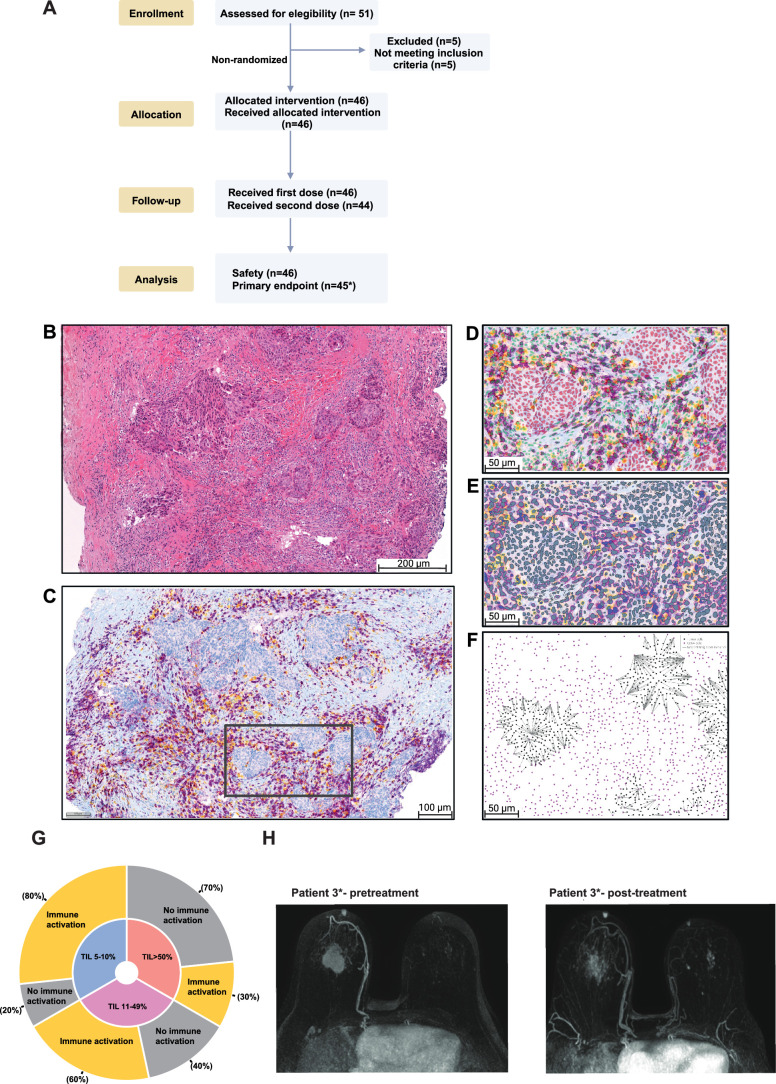
Extended Data Fig. 1. IHC CD8 + T cell analysis.
a. CONSORT Flow Diagram. Consort diagram of patients eligible, recruited, numbers followed up and included in analysis. *max 15 patients per cohort analyzed for primary end point b. H&E-stained image, corresponding to CD8/PD-1 stained tissue under C. c. Representative example of a CD8/PD-1 double-stained tissue (haematoxylin = blue, PD-1 = yellow, CD8 = purple). d. Representative example of the performance of the AI-based tumor cell classifier Tumor classification (red) and nontumor cells (green). e. Example of cell segmentation and tumor phenotype assignment. Cell with purple border = CD8+ cell, yellow border = PD-1+ cell, orange border = PD-1 + CD8+ cell. f. Corresponding distance analysis in the same tissue area as under D and E. The grey lines represent the shortest distance from a tumor cell to its nearest CD8 + T cell g. Proportions of patients reaching immune activation stratified according to TIL levels at inclusion in cohorts A and B. 10 patients had 5–10% TILs, 10 patients 11–49% TILs and 10 patients had 50% or more TILs. h. Pretreatment and post-treatment MRI images of patient #3 with a pathological complete response (pCR) at surgery after ICI only (cT2N0, ypT0N0). Figure A was created with BioRender.com. In A-B, one biopsy was analyzed per patient.

