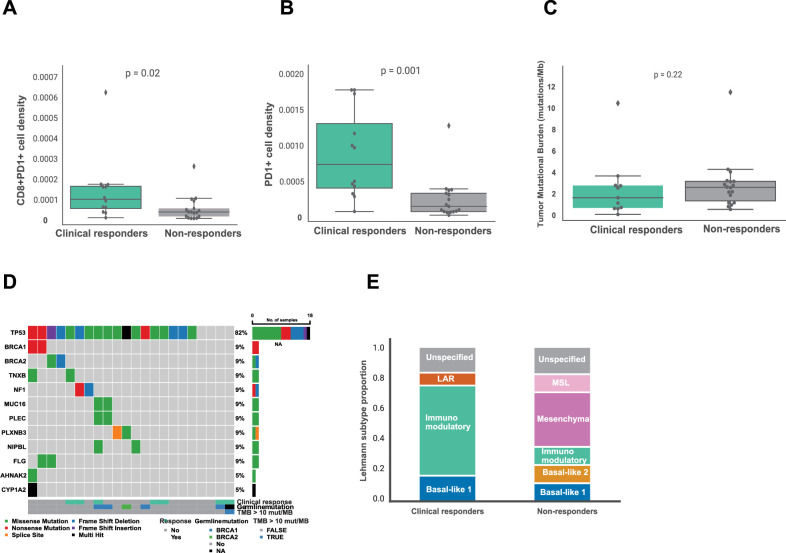
Extended Data Fig. 2. Baseline tumor microenvironment features and genomic profile of cohorts A and B.
a. PD-1 + CD8 + T cell density in pretreatment biopsies of patients with and without who did and did not experience clinical response in cohorts A and B. n = 31 patients. b. PD-1+ cell density in pretreatment biopsies of patients with and without who did and did not experience clinical response in cohorts A and B. n = 31 patients. c. Tumor mutational burden (TMB) in pretreatment biopsies of patients with and without clinical response in cohorts A and B. n = 30 patients. Boxplots display a minimum (Q0), a maximum (Q4), a median (Q2) and the interquartile range. Data were analyzed by a two-sided Mann–Whitney test. d. Oncoplot of TMB (mutations per megabase (Mb)) and top mutated genes in cohorts A and B. e. Proportions of Lehmann et al. subtypes33 in patients with and without clinical response in cohorts A and B. MSL, mesenchymal stem-like; LAR, luminal androgen receptor.

