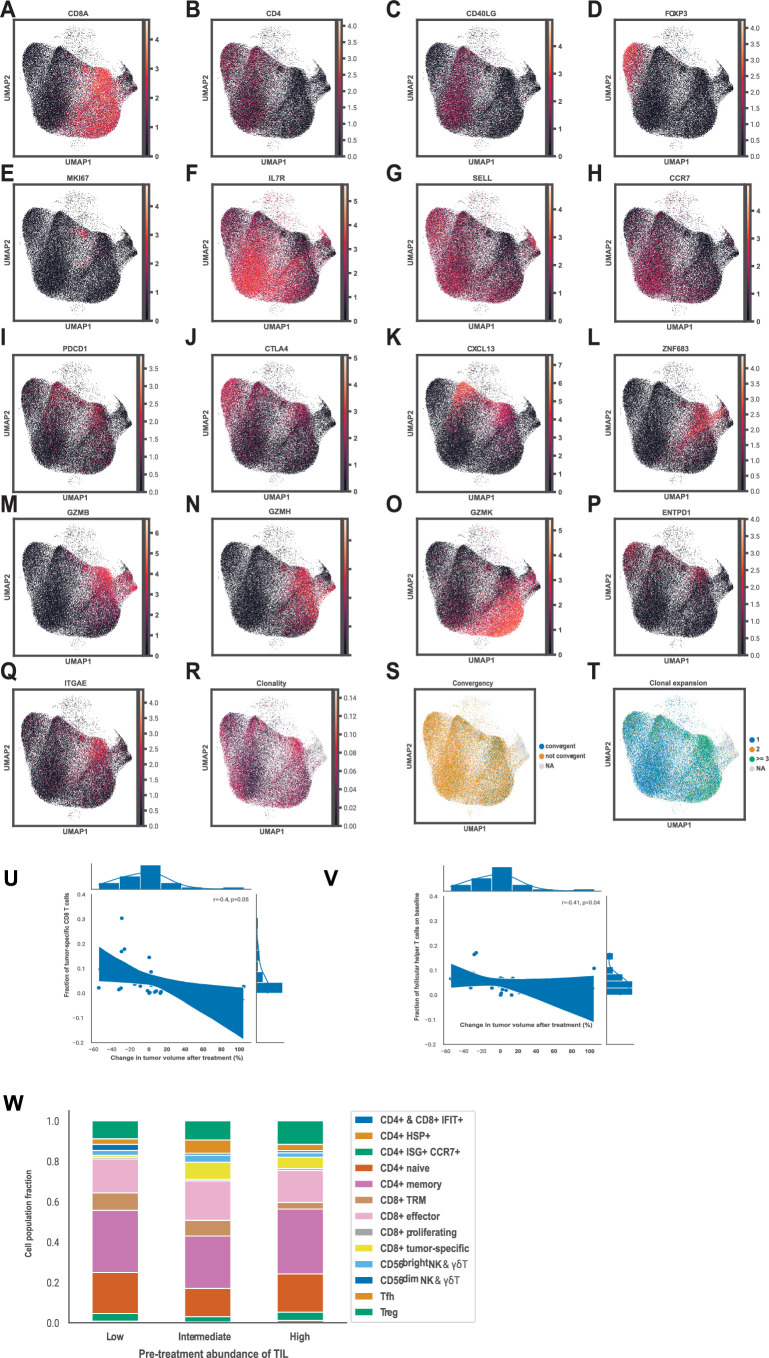
Extended Data Fig. 4. Single-cell RNA-Seq pretreatment tumor microenvironment profile of the cohorts A and B.
a-q. UMAP representations of the marker gene expression in the dataset. a. CD8A. b. CD4. c. CD40LG d. FOXP3 e. MKI67 f. IL7R. g. SELL. h. CCR7. i. PDCD1. j. CTLA4. k. CXCL13. l. ZNF683. m. GZMB. n. GZMH. o. GZMK. p. ENTPD1. q. ITGAE. r. UMAP representation of the T cell clonality in the dataset. s. UMAP representation of the T cell clone convergence in the dataset. t. UMAP representation of the T cell clonal expansion in the dataset. u. Fractions of tumor-reactive CD8 + T cells relative to all T cells in pretreatment biopsies of patients based on single-cell RNA-Seq data in relation to the change in tumor volume after treatment based on RECIST 1.1 in cohorts A and B. v. Fractions of Tfh cells relative to all T cells in pretreatment biopsies of patients based on single-cell RNA-Seq data in relation to the change in tumor volume after treatment based on RECIST 1.1 in cohorts A and B. w. Fractions of different T cell clusters relative to all T cells based on single-cell RNA-Seq data in pretreatment biopsies of patients who had low (5–10%), intermediate (11–49%) and high (>=50%) presence of tumor-infiltrating lymphocytes before treatment in cohorts A and B. In U-V, correlation was estimated with Spearman’s rank correlation coefficient, two-sided, with 95% confidence interval for the regression estimate.

