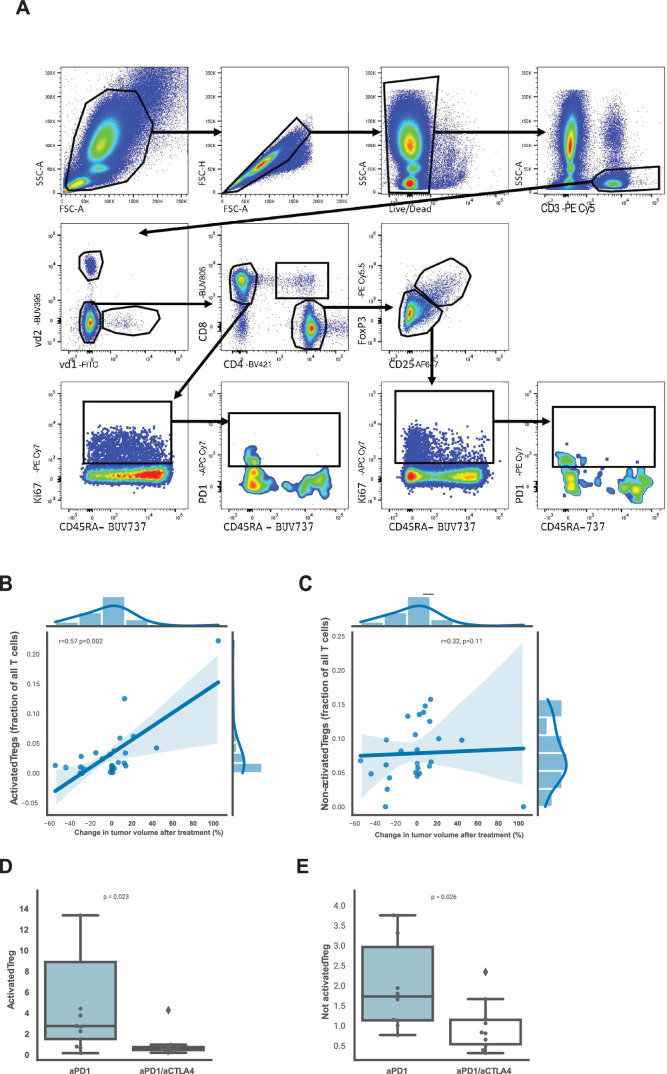
Extended Data Fig. 5. Gating strategy used for the flow cytometry data analysis and activated and non-activated Tregs in cohorts A and B.
a. Gating strategy used for the flow cytometry data analysis. b. Spearman correlation between fraction of activated Tregs and the change in tumor size on MRI (%). c. Spearman correlation between fraction of non-activated Tregs and the change in tumor size on MRI (%). Activated Tregs were defined as activated by the expression of CD137. d–e. Fold change in activated (d) and non-activated (e) Tregs after anti-PD-1 or anti-PD-1/anti-CTLA4 therapy. n = 22 patients. In B-C, correlation was estimated with Spearman’s rank correlation coefficient, two-sided, with 95% confidence interval for the regression estimate. In D–E, boxplots display a minimum (Q0), a maximum (Q4), a median (Q2) and the interquartile range. P values were derived using a two-sided Mann–Whitney test.

