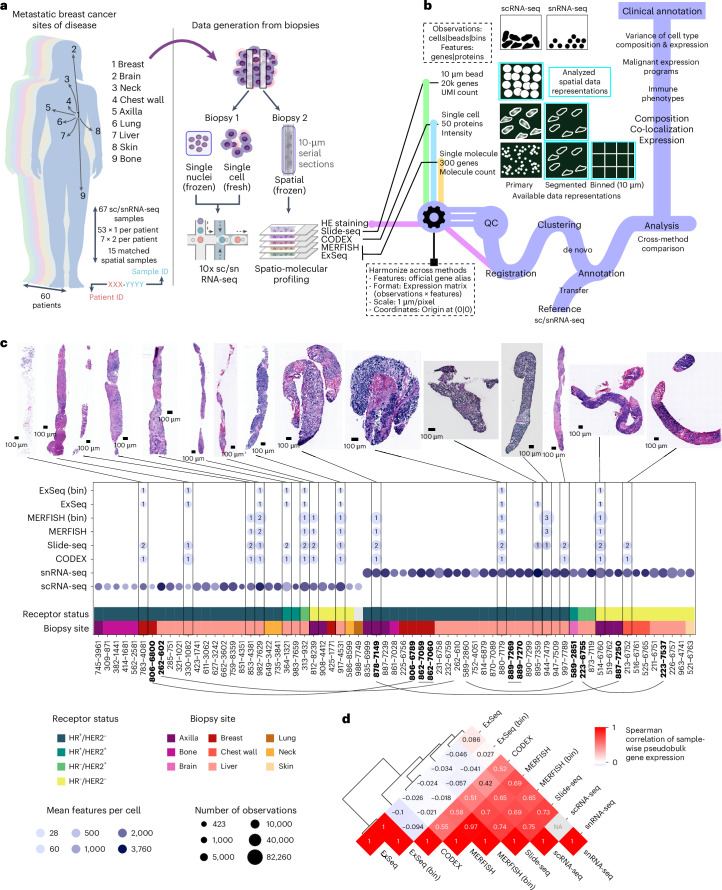
Fig. 1. Profiling of MBC biopsies using scRNA-seq, snRNA-seq and four spatial expression methods.
a, Schematic illustrating sample acquisition and data generation. Core biopsies dedicated to research were embedded in OCT or subjected to scRNA-seq. Per biopsy, one fresh or frozen core was used for scRNA-seq or snRNA-seq, respectively. For matching spatial profiling, a second, OCT-embedded core from the same biopsy procedure was cut in two sets of five 10-μm serial sections for processing with four spatial expression methods (Slide-seq, CODEX, MERFISH and ExSeq) and H&E staining. b, Schematic illustrating the properties of the different produced data types, the data processing framework and the performed analysis. c, Overview statistics of the produced scRNA-seq, snRNA-seq and spatial expression data as well as exemplary H&E images for the core biopsies used in spatial profiling. Biopsy site and receptor status for each of the profiled cores is indicated as well as the number of profiled observations (cells, beads or bins) and the number of detected features (RNA species or proteins). The number of replicates for each spatial expression method and biopsy is indicated in the respective blobs. HR, hormone receptor (ESR1 and PGR). Biopsies from the same patient are indicated with bold font and connected through lines. d, Clustered heatmap depicting the pair-wise Spearman correlation of methods based on sample-wise pseudobulk expression.

