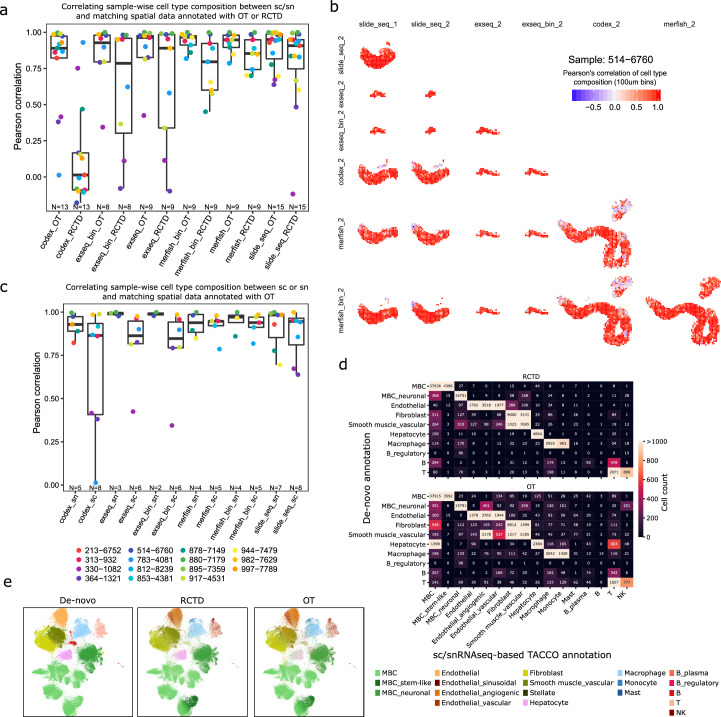
Extended Data Fig. 8. Correspondence of cell type composition across profiling methods and annotations.
a) Boxplots depicting the correlation of cell type composition between sc/snRNA-Seq and spatial methods, for each biopsy, stratified by annotation method (TACCO-OT or RCTD). The individual data points are overlaid. N indicates number of sample-pairs. b) Spatial scatter plots displaying the correlation between cell type compositions within 100×100 μm bins as measured by the indicated pairs of methods in the 514-6760 biopsy. c) Boxplots depicting the correlation of cell type composition between sc/snRNA-Seq and spatial methods, for each biopsy, stratified by single-cell profiling method (snRNA-Seq or sc RNAseq). The individual data points are overlaid. d) Heatmap depicting for the segmented MERFISH data, the congruence of cell type annotations based on manual cluster analysis/marker expression (de-novo) and automated sn/scRNA-Seq-based annotation by TACCO-OT or RCTD, respectively. Numbers indicate the number of cells with the respective annotation combination. e) UMAPs of all cell-segmented MERFISH data based on their expression profiles, with observations colored by cell type as annotated based on cluster analysis/marker expression (de-novo), or annotation transfer from sc/snRNA-Seq using TACCO-OT or RCTD respectively.

