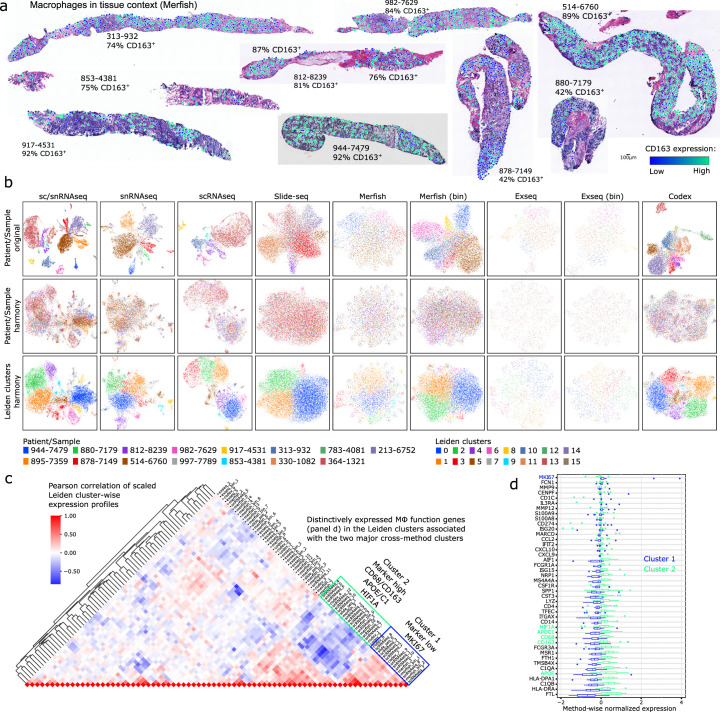
Extended Data Fig. 9. Characterization of macrophage subsets based on expression states across methods.
a) Spatial scatter plot overlaid onto H&E images depicting the expression levels of CD163 in macrophages for all biopsies, based on cell-segmented MERFISH data. b) UMAPs of all observations confidently annotated as macrophages across biopsies based on their unaligned or harmony sample-integrated expression profiles, colored by sample/patient or Leiden clusters (resolution: 0.6). c) Clustered heatmap depicting the pairwise Pearson correlation of scaled Leiden cluster-wise expression profiles across methods. Method and cluster ID (as in panel b) are indicated. d) Boxplots depicting the expression of macrophage marker and function genes in the method-specific macrophage clusters grouped in cross-method cluster 1 (N = 15) and 2 (N = 20) according to panel c). Genes are ordered by the median difference between cross-method cluster 1 and 2. N = method-specific clusters.

