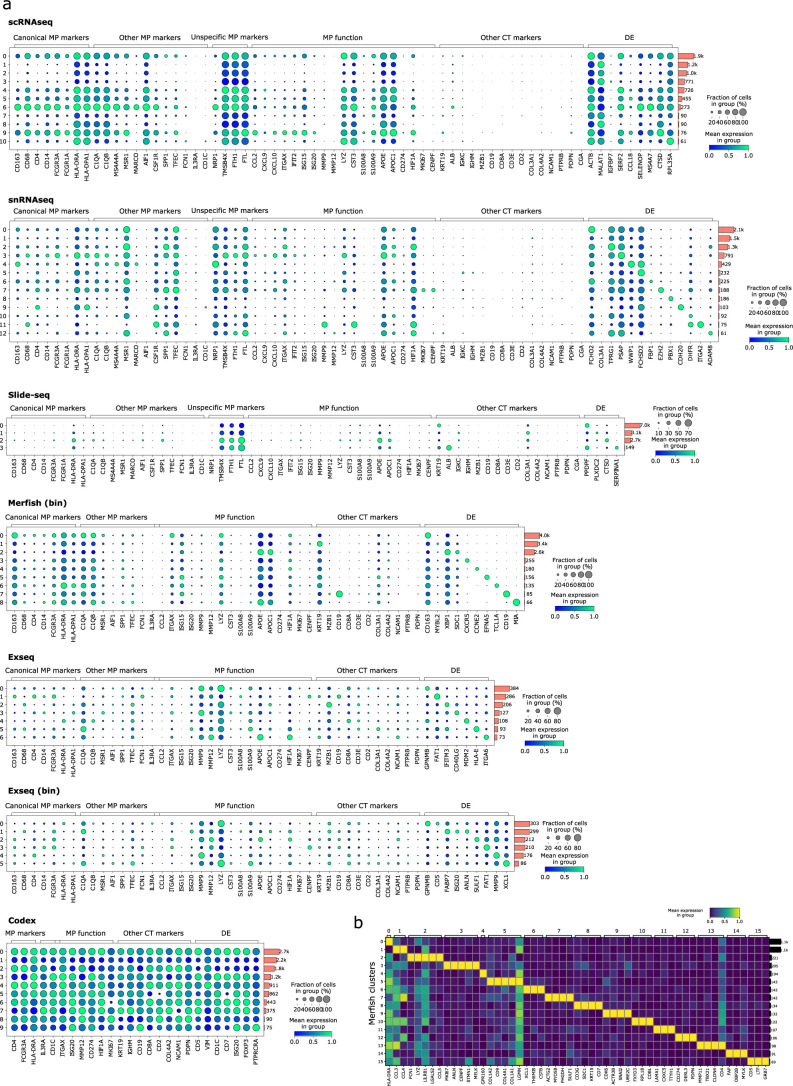
Extended Data Fig. 10. Macrophage subset marker gene expression.
a) Dot plots depicting the scaled expression (by gene, across clusters) and fraction of expressing cells of macrophage marker and function genes as well as marker genes for other cell types and differentially expressed genes between clusters as in Extended Data Fig. 9b for all methods as indicated. Side-barplots indicate the number of cells in each cluster. b) Heatmap of scaled (across clusters) gene expression showing the top up to five differentially expressed genes (FDR < 0.05, log-fold change > 1.5) between the indicated cell-segmented MERFISH clusters.

