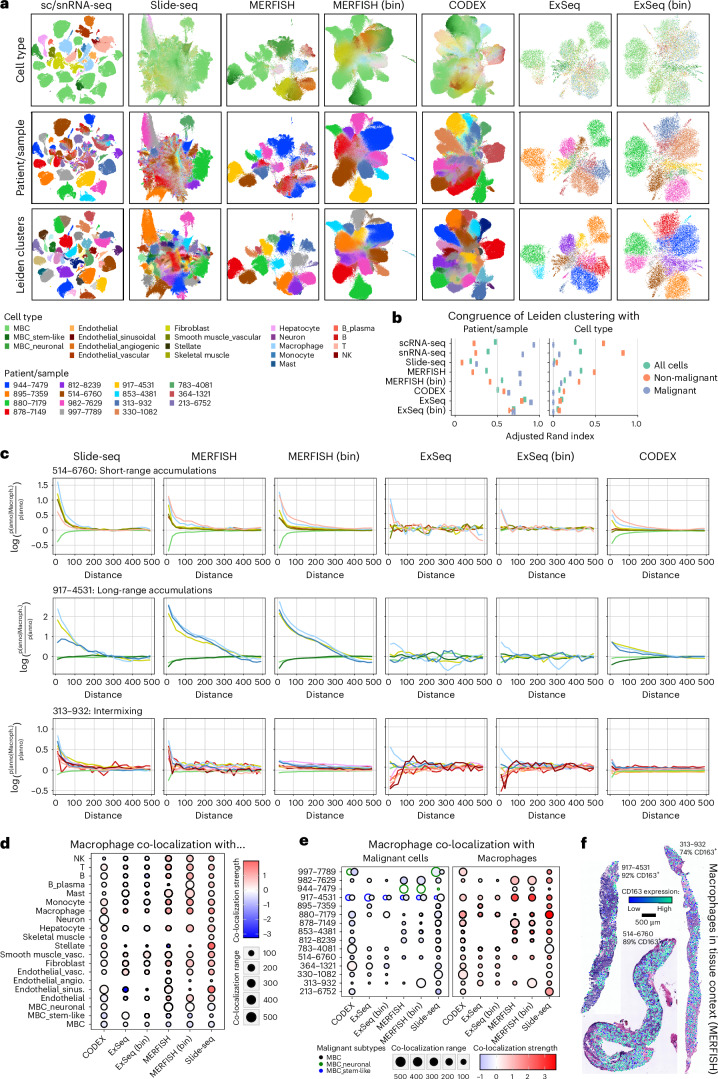
Fig. 4. Recovering spatial and molecular signals across spatial expression profiling methods.
a, UMAPs of all data across biopsies based on their expression profiles, generated with the indicated methods, with observations colored by TACCO-OT annotated cell type, patient/sample and Leiden clusters (resolution, 0.8). b, Error bar plot with mean ± s.d. showing the ARI quantifying cluster cohesion between Leiden clusters and patient/sample or cell type annotation across 10 bootstrapping iterations for each indicated method, as in a. ARI ranges between −1 and 1, where 1 indicates perfect agreement, 0 indicates a random agreement and −1 indicates completely different groupings. n = 10 bootstrapping iterations. c, Line plots depicting co-localization strength (y axis) of macrophages with all other measured cell types in dependence of distance (x axis), derived from the indicated data types in the indicated three biopsies, selected to represent three spatial co-localization phenotypes (short-range accumulation, long-range accumulations and intermixing). The distance is measured in μm. d, Dot plot displaying aggregated (mean across samples) co-localization range (size) and strength (color) of macrophages with all other cell types per method. Co-localization strength values lower than 0 indicate exclusion/repulsion. e, Dot plot displaying co-localization range (size) and strength (color) of macrophages with other macrophages or malignant cells for all samples and methods. Co-localization strength values lower than 0 indicate exclusion/repulsion. f, Spatial scatter plot of macrophages overlaid onto H&E images showing the expression levels of CD163 in the depicted macrophages, for the three example biopsies representing the three co-occurrence cases as in c, based on cell-segmented MERFISH data.

