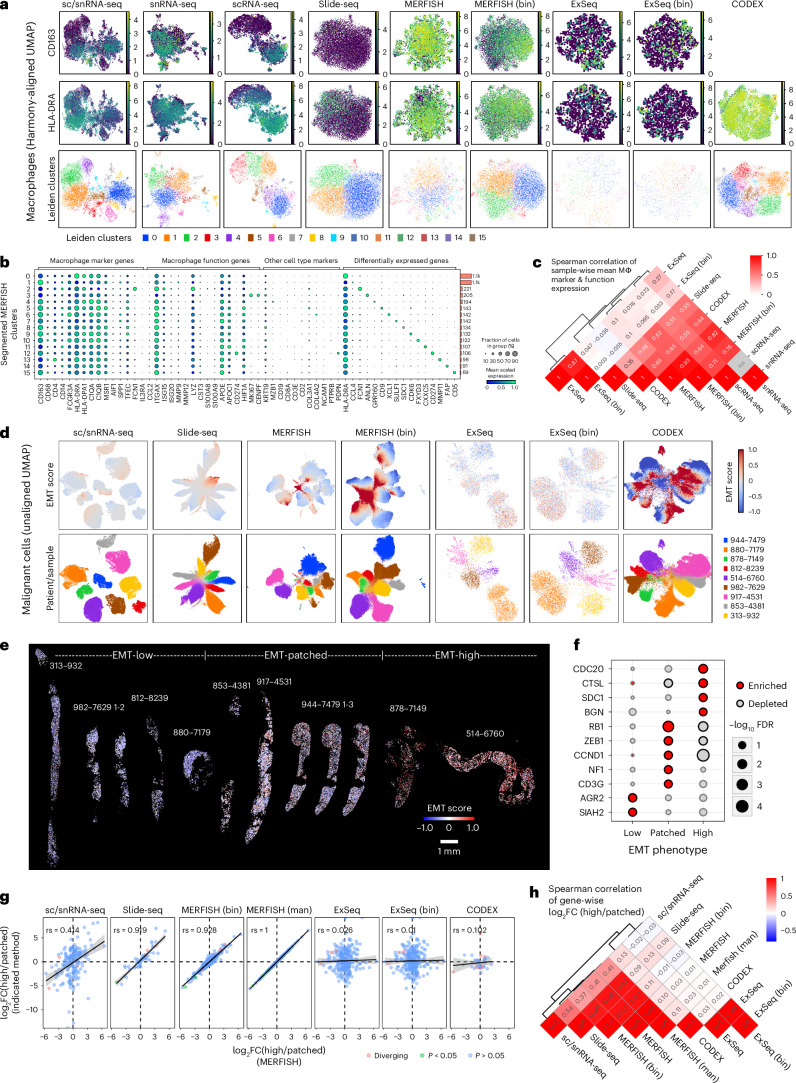
Fig. 5. Characterizing macrophage and malignant expression phenotypes across spatial expression profiling methods.
a, UMAPs of all observations confidently annotated as macrophages across biopsies based on their expression profiles, colored by log-normalized expression of CD163, log-normalized expression of HLA-DRA or Leiden clusters. b, Dot plot depicting the scaled expression (by gene, across clusters) and fraction of expressing cells of macrophage marker and function genes as well as marker genes for other cell types and differentially expressed genes between clusters as in a for cell-segmented MERFISH data. Side bar plots indicate the number of cells in each cluster. c, Clustered heatmap depicting the pair-wise Spearman correlation of methods based on sample-wise pseudobulk expression of macrophage marker and function genes as in b. d, UMAPs of all observations annotated as malignant cells across biopsies based on their expression profiles, colored by their EMT score expression (capped at −1 and 1 for comparability) or patient/sample. e, Spatial scatter plots of the cell-segmented MERFISH data where each cell is colored by its EMT score expression (capped at −1 and 1 for comparability). Samples are grouped into three spatial EMT phenotypes—EMT-high, EMT-low and EMT-patched—based on the distribution of the EMT signal across space. f, Dot plot depicting the differential expression significance (two-sided Welch’s t-test, Benjamini–Hochberg correction) of genes overexpressed in one of the three spatial EMT phenotypes (EMT-high, EMT-low and EMT-patched), as detected in the cell-segmented MERFISH data (e). g, Scatter plot relating the log fold changes of gene expression between EMT-high and EMT-patched samples as detected in cell-segmented MERFISH to the corresponding expression changes detected in the other indicated methods. The significance of differential expression was calculated by a two-sided Welch’s t-test and Benjamini–Hochberg correction. The Spearman correlation is indicated. Error bands indicate standard error. h, Clustered heatmap depicting the pair-wise Spearman correlation of methods based on gene-wise log fold changes between EMT-high and EMT-patched samples, defined as in e and related to g. FC, fold change; man, manual.

