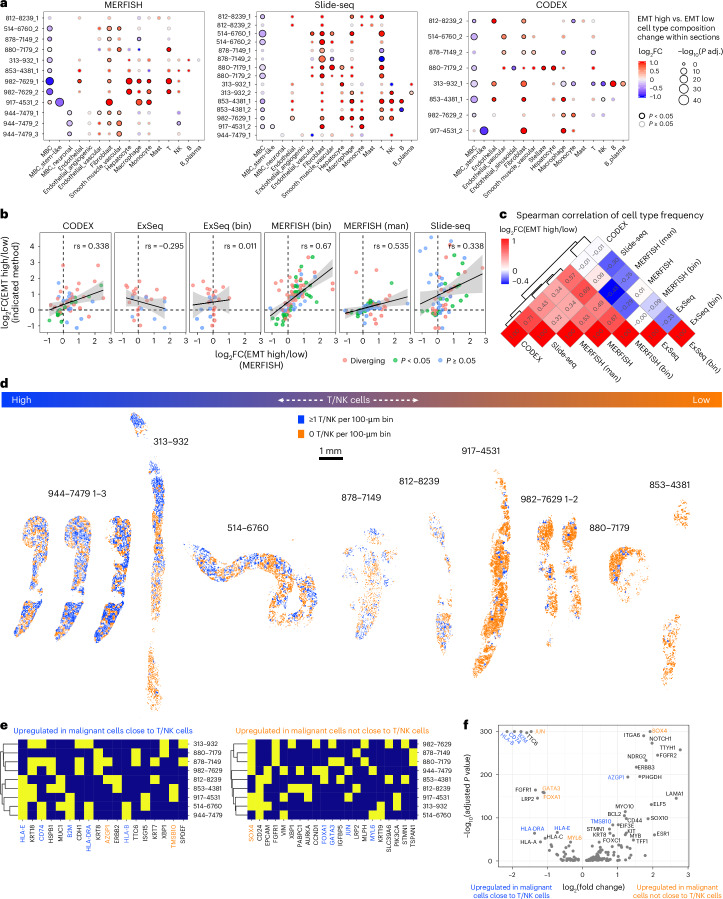
Fig. 6. Characterizing the cellular neighborhoods of malignant expression phenotypes across spatial expression profiling methods.
a, Dot plots depicting the log fold change (color) and significance (size) of differences in cell type frequencies between EMT-high and EMT-low neighborhoods (100 × 100-μm bins) within each section for MERFISH, Slide-seq and CODEX. ExSeq data did not yield any significant results. Replicates (serial sections) of the same biopsy are denoted with ‘_1–3’. P values were calculated using a two-sided Wilcoxon test and Benjamini–Hochberg multiple testing correction. b, Scatter plot relating the log fold changes of cell type frequency between EMT-high and EMT-low neighborhoods within samples as detected in cell-segmented MERFISH to the corresponding cell type frequency changes detected in the other indicated methods. The significance of differential cell type frequencies was calculated by a two-sided Wilcoxon test and Benjamini–Hochberg correction. The Spearman correlation is indicated; error bands indicate standard error. c, Clustered heatmap depicting the pair-wise Spearman correlation of methods based on cell type frequency log fold changes between EMT-high and EMT-low neighborhoods within samples, defined as in Fig. 5e, related to b. d, Spatial scatter plots of the malignant cells within the cell-segmented MERFISH data where each cell is colored as to whether or not it resides in the same 100 × 100-μm bin as at least one T/NK cell. e, Clustered binary heatmaps of whether or not a gene is among the top 10 differentially expressed genes between malignant cells residing close to a T/NK cell and those that do not within each biopsy, measured by cell-segmented MERFISH. Only genes that occur in at least two samples are shown. Genes are colored by their directionality in the common differential expression analysis. Genes with different directionality between patient-specific and combined analysis show discordant coloring. f, Volcano plot of differential gene expression analysis (two-sided Wilcoxon test, Benjamini–Hochberg correction) between malignant cells residing close to a T/NK cell and those that do not across all biopsies, measured by cell-segmented MERFISH data. Genes are colored by their directionality in the sample-specific differential expression analysis. Genes with different directionality between patient-specific and combined analysis show discordant coloring. FC, fold change; man, manual.

