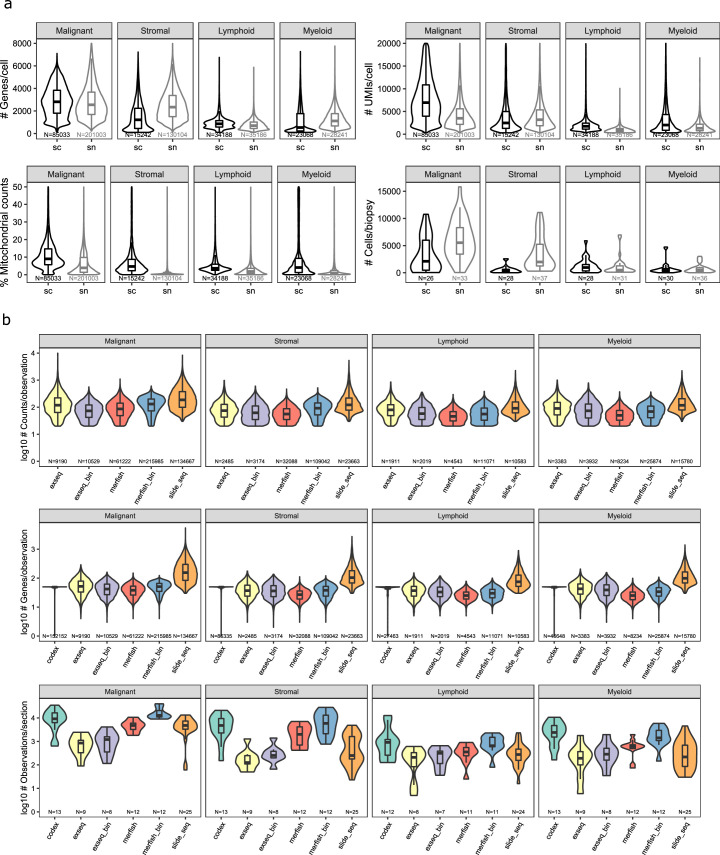
Extended Data Fig. 2. Quality statistics overview for sc/snRNA-Seq and spatial methods.
a) Box- and violin plots depicting the distribution of the indicated quality measures for snRNA-Seq and scRNA-Seq data, stratified by cell type compartment (malignant, stromal, lymphoid, myeloid). N indicates cells or biopsy samples according to the axis labels. b) Box- and violin plots depicting the distribution of the indicated quality measures for the indicated spatial methods, stratified by cell type compartment (malignant, stromal, lymphoid, myeloid). N indicates observations (cells, beads, or bins) or tissue sections according to the axis labels.

