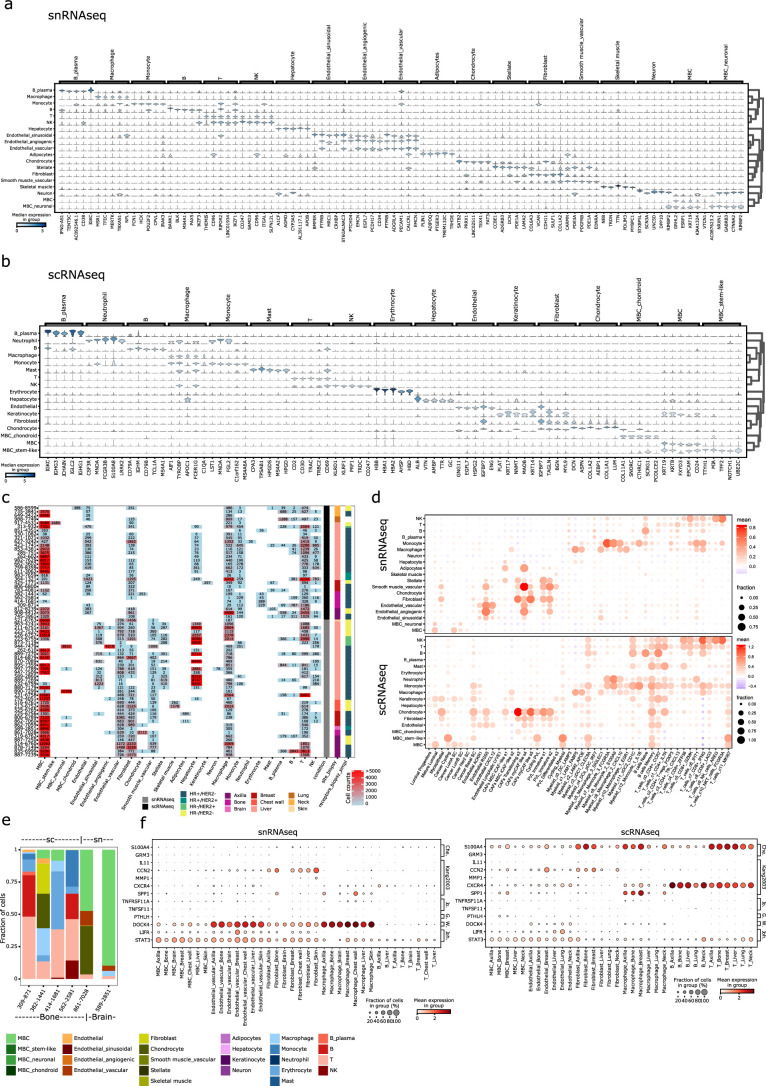
Extended Data Fig. 3. Cell type characterization of the sc/snRNA-Seq data.
a, b) Stacked violin plots depicting the expression of the top 5 cell type marker genes for each of the indicated cell types, detected by 1 vs. all differential expression analysis for the snRNA-Seq data (panel a) and scRNA-Seq data (panel b). c) Heat map depicting the number of cells of each cell type detected in each of the samples. The color scale corresponds to the indicated respective number of cells. d) Dot plots depicting the expression level (mean expression) and frequency (fraction of expressing cells) of the indicated previously published cell subtype signatures17 across cells of the annotated broader cell types. e) Stacked barplot showing the cell type composition for biopsies of bone and brain metastasis. f) Dot plots depicting the expression of genes reported to be implicated in bone metastasis (Che.: Chen201727, Kang200324, Jo.:Jones200625, G.:Guise199623, W.:Westbrook201828, Joh.:Johnson201626) across cell types and metastatic sites covered in the snRNA-Seq (left) and scRNA-Seq (right) dataset, respectively.

