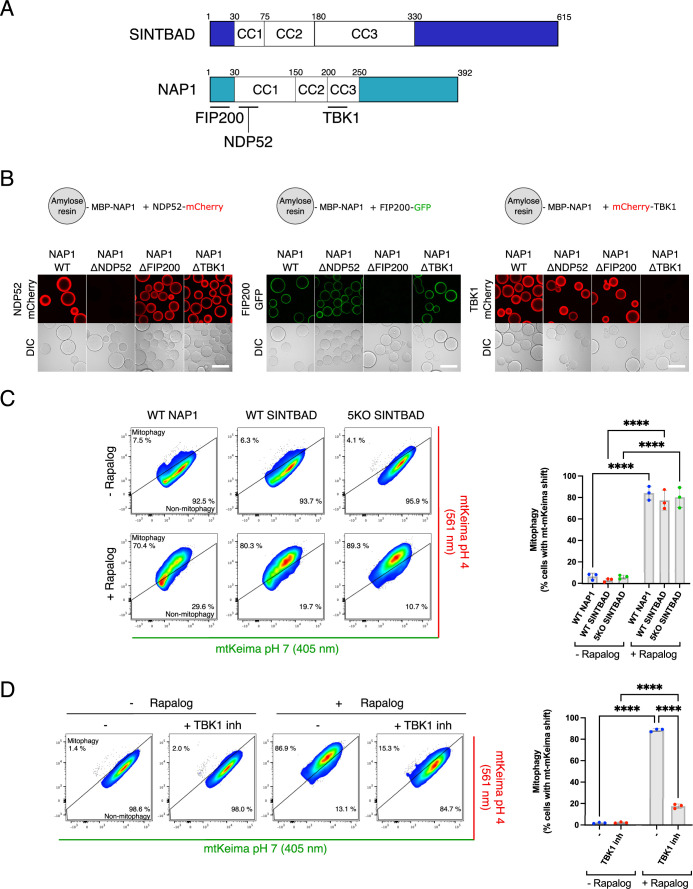
Extended Data Fig. 3. Validation of NAP1 mutants and side-by-side comparison of SINTBAD.
(a) Diagram of the domain structure of NAP1 and SINTBAD, with binding sites for NDP52, FIP200, and TBK1 indicated. Coiled coil (CC) domains are also indicated based on the predicted structure by AF2. (b) Microscopy-based bead assay to validate point mutants in NAP1 in the binding regions for NDP52 (S37K/A44E), FIP200 (I11L/L12S), and TBK1 (L226Q/L233Q). These loss-of-binding mutants were employed in Fig. 4. (c) Mitophagy flux was measured by flow cytometry in wild-type (WT) or pentaKO (5KO) HeLa cells expressing BFP-PARKIN, FRB-Fis1, FKBP-GFP-NAP1 or FKBP-GFP-SINTBAD, and mt-mKeima, not induced or induced for 24 h by rapalog treatment. The percentage of mitophagy-induced cells (upper left) is quantified (mean ± s.d.) (n = 3 biologically independent experiments). Scale bars are 100 µm. Two-way ANOVA with Tukey’s multiple comparisons test was performed. ****P < 0.0001. (d) As in (C) for FKBP-GFP-SINTBAD, with the pentaKO background, but with and without the addition of the TBK1 inhibitor (GSK8612) (mean ± s.d.) (n = 3 biologically independent experiments). Two-way ANOVA with Tukey’s multiple comparisons test was performed. ****P < 0.0001. Source numerical data, including exact P values, are available in source data.

