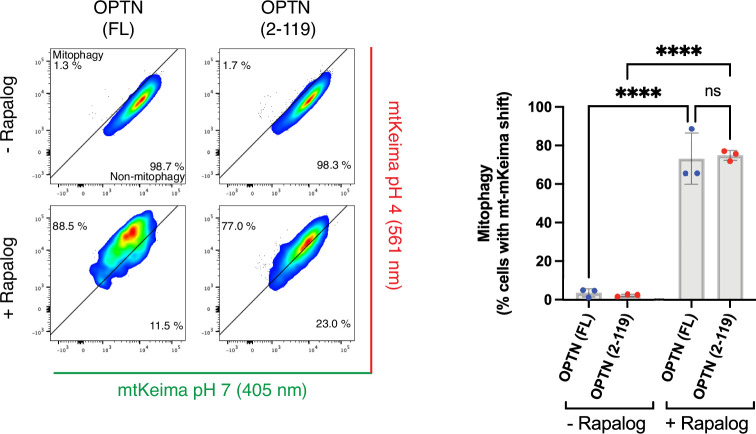
Extended Data Fig. 8. Chemical-dimerization assay with full-length OPTN and OPTN (2-119).
PentaKO HeLa cells expressing mt-mKeima, Fis1-FRB and FKBP-OPTN wild-type (WT) or amino acids 2-119 (2-119) were left untreated or treated with rapalog for 24 hours as indicated. The mitophagy flux was analyzed by flow cytometry. Representative FACS plots are shown. The percentage of mitophagy-induced cells (upper left) is quantified (mean ± s.d) (n = 3 biologically independent experiments). Two-way ANOVA with Tukey’s multiple comparisons test. ****P < 0.0001. Source numerical data, including exact P values, are available in source data.

