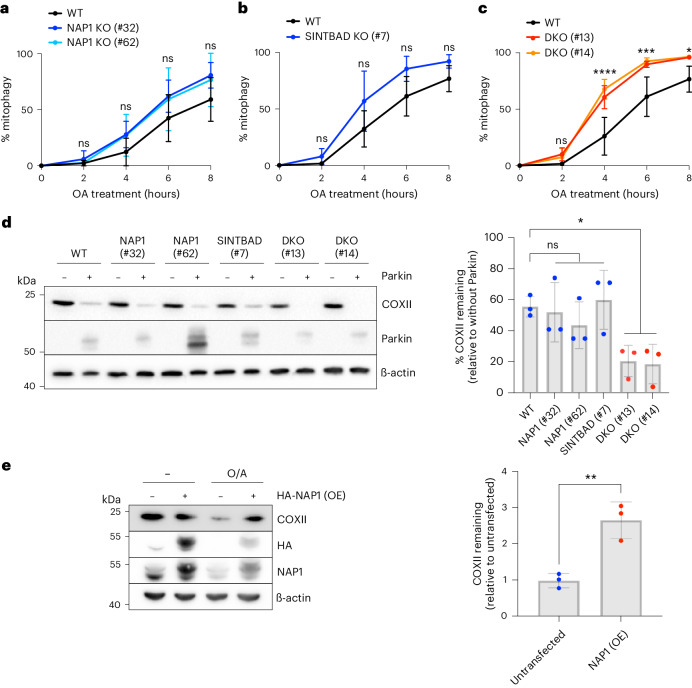
Fig. 2. NAP1 and SINTBAD are negative regulators of mitophagy.
a–c, Mitophagy flux was measured by flow cytometry in indicated HeLa cell lines expressing YFP–Parkin and mt-mKeima, untreated or treated with O/A for indicated times: WT versus NAP1 knockout (KO) (a), SINTBAD KO (b) or NAP1 and SINTBAD DKO cells (c) (mean ± s.d.) (n = 3 biologically independent experiments). Two-way ANOVA with Tukey’s multiple comparisons test was performed in a and c, and with Šídák’s multiple comparison test in b. (d) Immunoblotting of COXII levels in various HeLa cell lines treated with O/A for 18 h. PINK1/Parkin-dependent versus PINK1/Parkin-independent mitophagy was compared by overexpression of YFP–Parkin. Densitometric analysis was performed for the percentage of COXII remaining (mean ± s.d.) (n = 3 biologically independent experiments). One-way ANOVA with Dunnett’s multiple comparison test was performed. (e) Immunoblotting of COXII levels in HeLa cells overexpressing (OE) HA-NAP1 and treated with O/A for 16 h. The proportion of COXII remaining after O/A relative to the untransfected sample was quantified. Densitometric analysis was performed for COXII (mean ± s.d.) (n = 3 biologically independent experiments). A two-tailed unpaired Student’s t-test was performed. *P < 0.05; **P < 0.005; ***P < 0.001; ****P < 0.0001; ns, not significant. Source numerical data, including exact P values, and unprocessed blots are available in source data.

