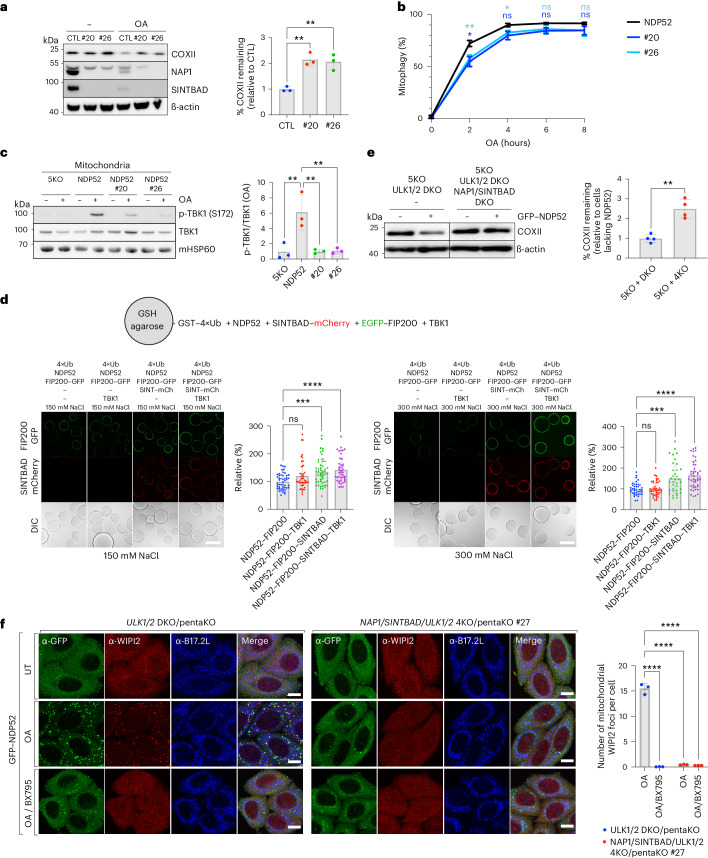
Fig. 3. NAP1 and SINTBAD support NDP52-mediated mitophagy by stabilizing interactions with the autophagy machinery.
a, PentaKO (parental control, CTL) and NAP1/SINTBAD DKO/pentaKO (clones #20 and #26) expressing BFP–Parkin and GFP–NDP52 were treated with O/A for 16 h and analyzed by immunoblotting. Densitometric analysis was performed for COXII (mean ± s.d.) (n = 3 biologically independent experiments). One-way ANOVA with Dunnett’s multiple comparison test was performed. b, Indicated cell lines expressing BFP–Parkin and mt-mKeima were treated with O/A for indicated times. Mitochondrial flux was measured by flow cytometry (mean ± s.d.) (n = 3 biologically independent experiments). Representative FACS plots are provided in Extended Data Fig. 2. Two-way ANOVA with Tukey’s multiple comparisons test was performed. c, Crude mitochondria were isolated from pentaKO (5KO) and NAP1/SINTBAD DKO/pentaKO (clones #20 and #26) expressing BFP–Parkin and GFP–NDP52 untreated or treated with O/A for 1 h and analyzed via immunoblotting with indicated antibodies. The fraction of p-TBK1 over total TBK1 was quantified by densitometric analysis (mean ± s.d.) (n = 3 biologically independent experiments). One-way ANOVA with Dunnett’s multiple comparison test was performed. d, Biochemical reconstitution of mitophagy initiation by NDP52. Glutathione sepharose beads coated with GST-tagged linear ubiquitin chains (GST–4×Ub) were incubated with NDP52, SINTBAD–mCherry, TBK1 and FIP200–GFP, as indicated, in bead assay buffer containing either 150 mM or 300 mM NaCl and supplemented with ATP/MgCl2. Samples were analyzed by confocal imaging. The mean signal intensity for an individual bead was quantified and plotted as individual data points (mean ± s.d.) (n = 35 beads or more per condition examined over three independent experiments). One-way ANOVA with Dunnett’s multiple comparison test was performed. Scale bar, 100 µm. e, PentaKO with ULK1/2 DKO and pentaKO with ULK1/2/NAP1/SINTBAD 4KO (clones #13 and #27) expressing BFP–Parkin and GFP–NDP52 were treated with O/A for 16 h and analyzed by immunoblotting. Densitometric analysis was performed for COXII (mean ± s.d.) (n = 4 biologically independent experiments). Two-tailed unpaired Student’s t-test was performed. f, PentaKO with ULK1/2 DKO and pentaKO with ULK1/2/NAP1/SINTBAD 4KO HeLa cells stably expressing BFP–Parkin were left untreated or treated with O/A or O/A plus TBK1 inhibitor (BX795) for 1 h, and immunostained with indicated antibodies. Note the defect in GFP–NDP52 recruitment in #27 owing to failure of recruiting downstream ATG8 molecules, which feedback and stabilize NDP52 (ref. 79). Scale bars, 10 µm. Number of mitochondrial WIPI2 foci per cell was quantified (mean ± s.d.) (n = 3 biologically independent experiments). Two-way ANOVA with Tukey’s multiple comparisons test was performed. *P < 0.05; **P < 0.005; ***P < 0.001; ****P < 0.0001; ns, not significant. Source numerical data, including exact P values, and unprocessed blots are available in source data.

