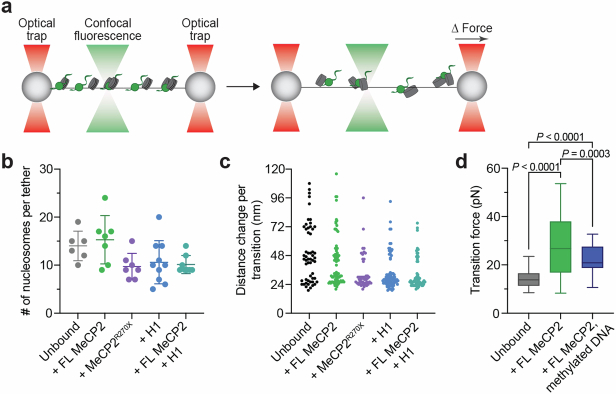
Extended Data Fig. 6. Evaluation of in situ nucleosome loading on λ DNA tethers.
a, Schematic of the experimental setup. Nucleosomal DNA was formed by incubating a λ DNA tether with histone octamers and Nap1, and then subjected to mechanical pulling by separating the two traps at a constant speed, resulting in force-induced nucleosome unwrapping. b, Number of nucleosomes loaded per tether as estimated by the number of nucleosome unwrapping events detected in the force-distance curves of tethers with no MeCP2 or H1 bound (n = 6 independent tethers), bound with full-length (FL) MeCP2 (n = 7 independent tethers), with MeCP2R270X (n = 7 independent tethers), with H1 (n = 10 independent tethers), or with both FL MeCP2 and H1 (n = 8 independent tethers). Bars represent mean and s.d. c, Distribution of the distance change per transition recorded from force-distance curves of tethers with no MeCP2 or H1 bound (n = 61 from 6 independent tethers), bound with FL MeCP2 (n = 76 from 7 independent tethers), with MeCP2R270X (n = 50 from 7 independent tethers), with H1 (n = 79 from 10 independent tethers), or with both FL MeCP2 and H1 (n = 63 from 8 independent tethers). Transition sizes are multiples of 24 nm, consistent with the unwrapping of the inner turn DNA of individual nucleosomes. d, Distribution of transition forces recorded from force-distance curves of nucleosomal DNA tethers with no MeCP2 bound (n = 84 from 5 independent tethers), bound with FL MeCP2 (n = 107 from 7 independent tethers), or methylated nucleosomal DNA tethers bound with FL MeCP2 (n = 55 from 5 independent tethers). Box boundaries represent 25th to 75th percentiles, middle bar represents median, and whiskers represent minimum and maximum values. Significance was calculated using a one-way ANOVA with Tukey’s test for multiple comparisons.

