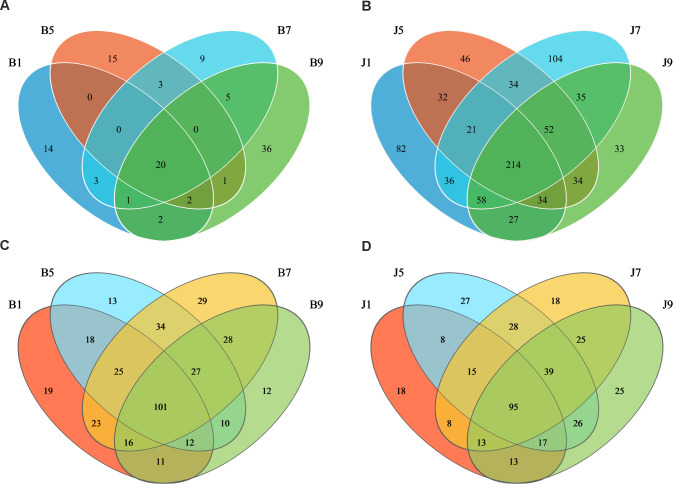
Figure 3.
Venn diagram showing the number of bacterial and fungal OTUs observed in different groups at four different disease severity. Bacterial Venn diagram in diseased (A) and healthy (B) groups at four different disease severities. Fungal Venn diagram in diseased (C) and healthy (D) groups at four different disease severities. Numbers in the overlapping region indicated unique OTUs for two or three samples. Numbers in the non-overlapping regions indicated unique OTUs for the group.

