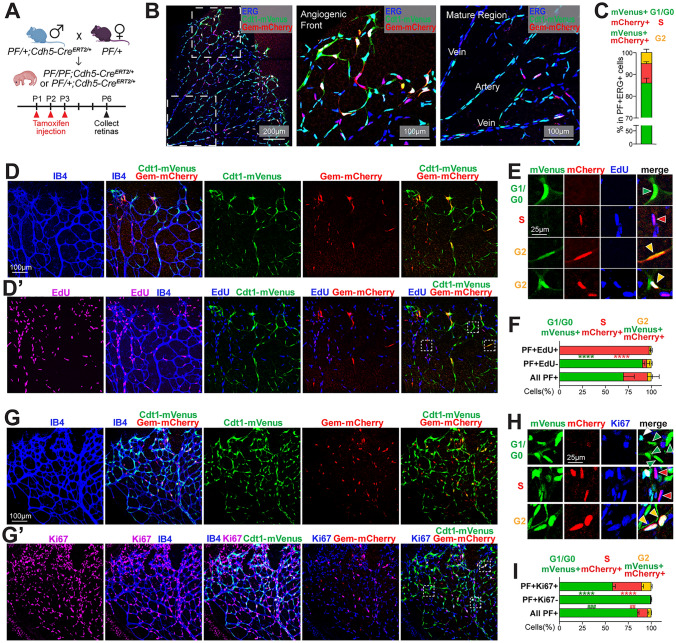
Fig. 2.
PIP-FUCCI mouse reports cell cycle status in postnatal retinal vessels in vivo. A Breeding scheme and schedule for PF/PF;Cdh5-CreERT2/+ and PF/+;Cdh5-CreERT2/+ pups. B Representative images of one leaflet of a PF/PF;Cdh5-CreERT2/+ retina stained for ERG. Boxed areas in far left panel (scale bar, 200 μm) are magnified (scale bar, 100 μm) in middle (Angiogenic Front) and far right (Mature Region) panels. C Quantification of whole retina endothelial cell cycle phase analysis from PIP-FUCCI labeled P6 retinas stained for ERG (blue). n = 4 pups. D–F Representative images (D–E) and quantification (F) of P6 PIP-FUCCI labeled retinas stained for IB4 (blue) and EdU-labeled (purple or blue). E Representative cells (arrowheads) PIP-FUCCI labeled as in G1/G0 (green), S (red), or G2 (yellow) cell cycle phase, magnified from white boxed areas in D’ (top 3 rows of E) and another area of the same retina (bottom row). Scale bar (D) 100 μm; (E) 25 μm. F Indicated quantification, n = 3 pups. ****p < 0.0001 by Two-way ANOVA & Sidak’s multiple comparisons test comparing PF+EdU+ and all PF+ cells. G–I Representative images (G–H) and quantification (I) of PIP-FUCCI labeled P6 retinas stained for IB4 (blue) and Ki67 (purple). H Representative cells (arrowheads) PIP-FUCCI labeled as in G1/G0 (green), S (red), or G2 (yellow) cell cycle phase, magnified from white boxed areas in G’. Scale bar (G) 100 μm, (H) 25 μm. I Indicated quantification, n = 2 pups. ****p < 0.0001 by Two-way ANOVA & Sidak’s multiple comparisons test comparing PF+Ki67+ and all PF+ cells; ###p < 0.001, ##p < 0.01 comparing PF+Ki67- and All PF+ cells

