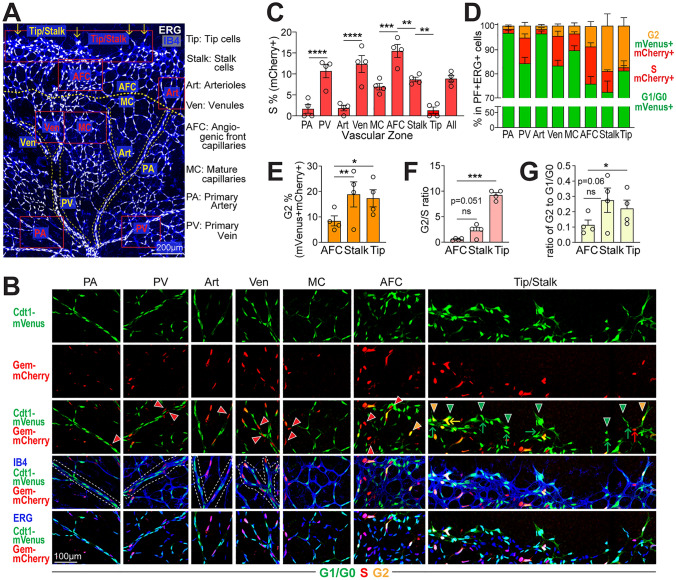
Fig. 3.
Spatial analysis reveals cell cycle differences in different retinal vascular zones. A A representative ERG (white)/IB4 (blue) labeled P6 retina image. Yellow dotted lines and labels, vascular zones used for pipeline quantification of endothelial cells cycle status; yellow arrows, endothelial cells defined as tip/stalk cells; red boxes, areas shown with additional markers and resolution in panel B. Label definitions to right. Scale bar, 200 μm. B High resolution views with additional markers of areas in (A) denoted by red boxes. ERG + endothelial cells labeled mVenus+, mCherry− (G1/G0), green arrowheads/arrows; mVenus-, mCherry+ (S), red arrowheads/arrows; and mVenus+, mCherry+ (G2M), yellow arrowheads/arrows; in labelled retinal vascular zones. In Tip/Stalk panel: arrows, stalk cells; arrowheads, tip cells. White dotted lines, PA, PV, Art and Ven outlines. Scale bar, 100 μm. C Quantification of % mVenus-, mCherry+ (S phase), ERG+ endothelial cells across vascular zones. All reporter-labelled ERG+ cells from each retina were quantified. ****p < 0.0001, ***p < 0.001, **p < 0.01 by one-way ANOVA & Sidak’s multiple comparisons test. D Quantification of endothelial cells (ERG+) labeled G1/G0, S and G2M in retinal vascular zones. All reporter-labelled ERG+ cells from each retina were quantified. E–G Comparison of AFC, Stalk and Tip cells. E Quantification of % mVenus+, mCherry+, ERG+ (G2) endothelial cells. **p < 0.01, *p < 0.05 by one-way ANOVA & Sidak’s multiple comparisons test. F Ratio of endothelial cells in G2 to S, G ratio of endothelial cells in G2 to G1/G0 in AFC vs. tip cells vs. stalk cells. *p < 0.05, ***p < 0.001 by paired t test. n = 4 pups for all quantifications

