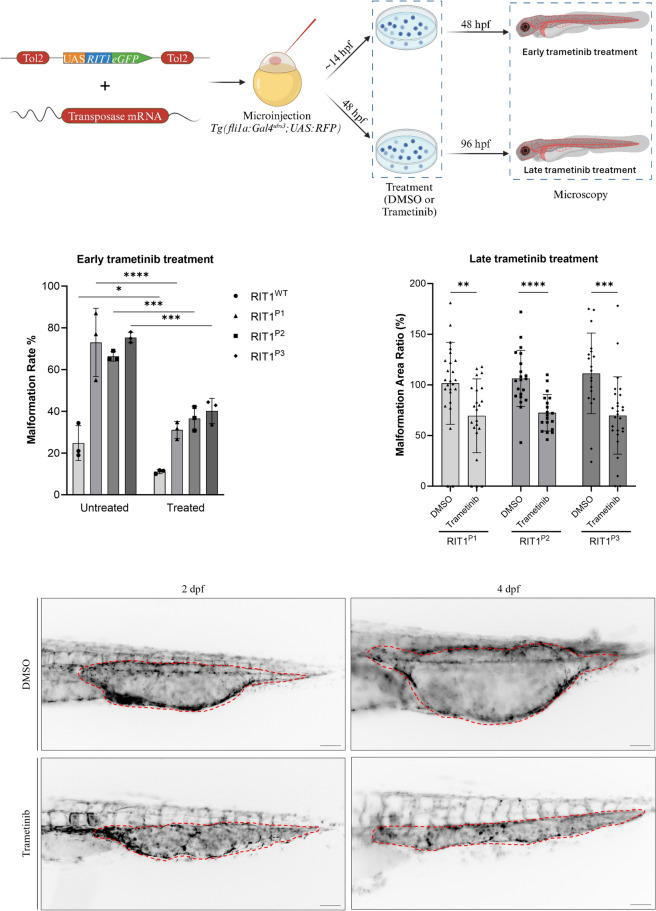
Fig. 4.
RIT1 variants injected zebrafish embryos respond to early and late treatment with MEK inhibitor trametinib. a Experimental plan to assess the effect of trametinib on the RIT1 injected zebrafish embryos after early and late treatments. Embryos are treated with trametinib either from 14hpf or 48 hpf on followed by an examination at 48 hpf (early treatment) or 96 hpf (late treatment) respectively. Presence of vascular malformation is calculated for early treatment embryos. Malformation area is calculated before and after trametinib treatment for each embryo in the late treatment group. b Quantification of the vascular anatomy at 48 hpf following the injection of plasmids containing the indicated RIT1 variants and treatment at 14 hpf. Experiments were performed with three biological replicates. Number of total examined embryos post-treatment: RIT1WT = 73, RIT1P1 = 60, RIT1P2 = 51, RIT1P3 = 38. Fisher’s exact test, two-tailed. P value *< 0.05, ***< 0.001; ****< 0.0001. Data are presented as mean ± SD. c Quantification of the relative change in the size of the AVM-like lesions after 2 days of treatment. Experiments were performed with three biological replicates. Number of total examined embryos: RIT1P1 = 48, RIT1P2 = 40, RIT1P3 = 46. Unpaired t-test, two-tailed. P value **< 0.01; ***< 0.001; ****< 0.0001. Data are presented as mean ± SD. d Example of image analysis to measure the relative change of lesion size during trametinib treatment from 2 to 4 dpf. Scale bar 50 µm

