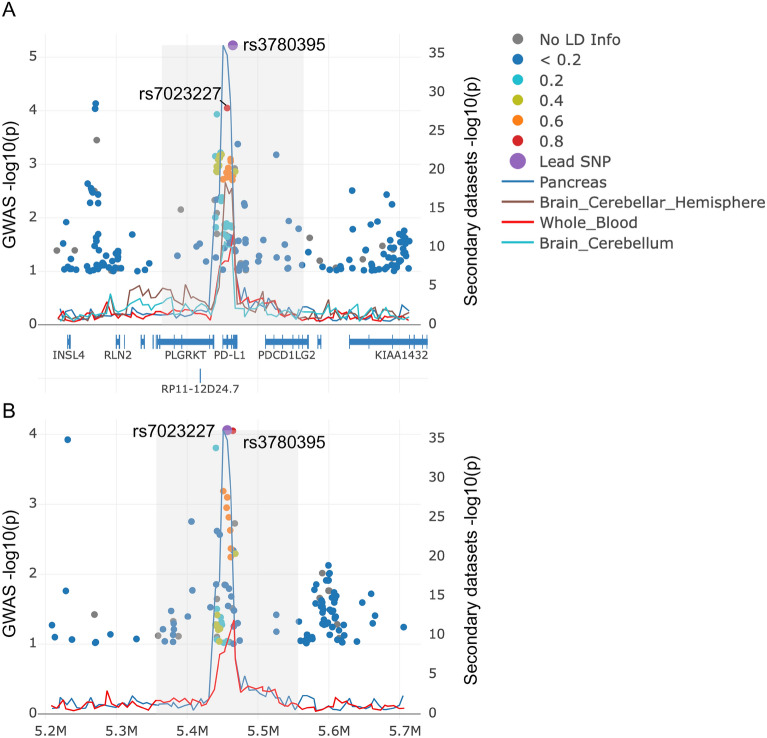
Fig. 3.
LocusFocus Manhattan plots for rs3780395 and rs7023227 in (A) the UK Biobank and (B) the CCSS-Rad-study GWAS results for tinnitus. Trendlines represent the most significant regional variant associations in eQTL datasets for PD-L1 expression. Only tissues with significant colocalization are included. Details of the colocalization analyses are provided in Supplemental Figs. 4 and 5. GWAS variants with − log10(p) < 1 are excluded from the plot. For plotting B, reference and alternative allele information were inferred from UK Biobank. Gray areas highlight the 100 kb distance from the GWAS lead variants that were used for the colocalization analyses.

