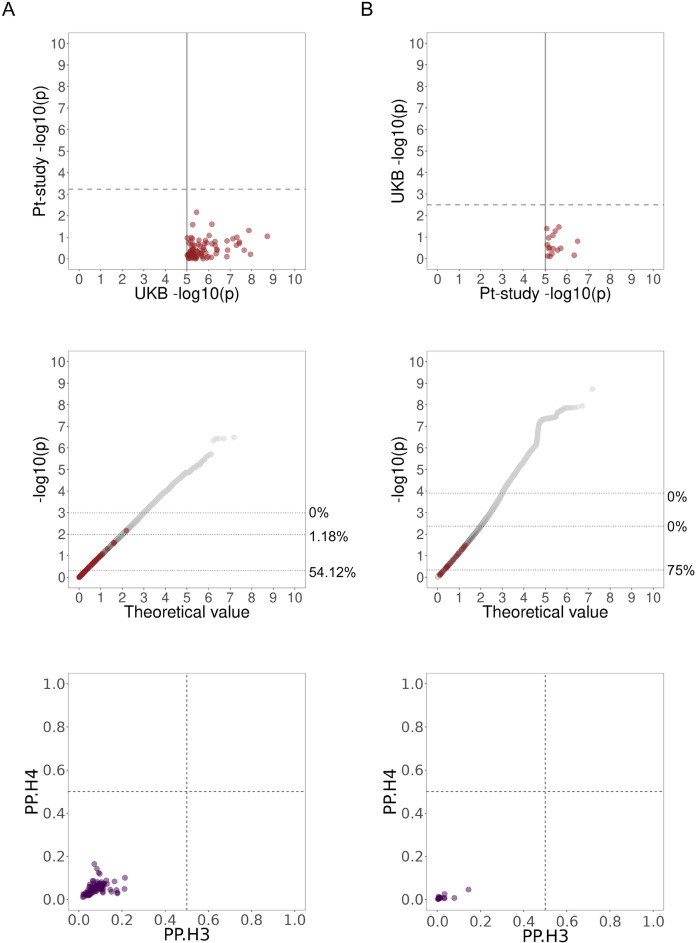
Fig. 4.
Pairwise comparison of tinnitus GWAS results across UK Biobank and Pt-study using cutoff of 10–5. (A) UK Biobank as the base GWAS. (B) Pt-study as the base GWAS. Top panel shows − log10(p) of the lead variants from the base GWAS in the secondary GWAS. Solid lines show the 10–5 threshold and dashed lines show the Bonferroni corrected thresholds. Middle panel shows position of the lead variants in the base GWAS (red) in the QQ plot of the target GWAS results (grey). Dotted lines show the 50th, 99th and 99.9th percentiles of the target dataset and values next to them show percent of the lead variants of the base dataset above each line. Bottom panel shows colocalization results for loci consisting of variants within 250 kb of the lead variants in the base dataset with p-values below the 10–5 cutoff. Dashed lines show 0.5 colocalization cutoffs for the posterior probabilities. PP.H4 is the posterior probability that the GWAS signals are colocalized and PP.H3 is the posterior probability that there are two independent signals in the locus.

