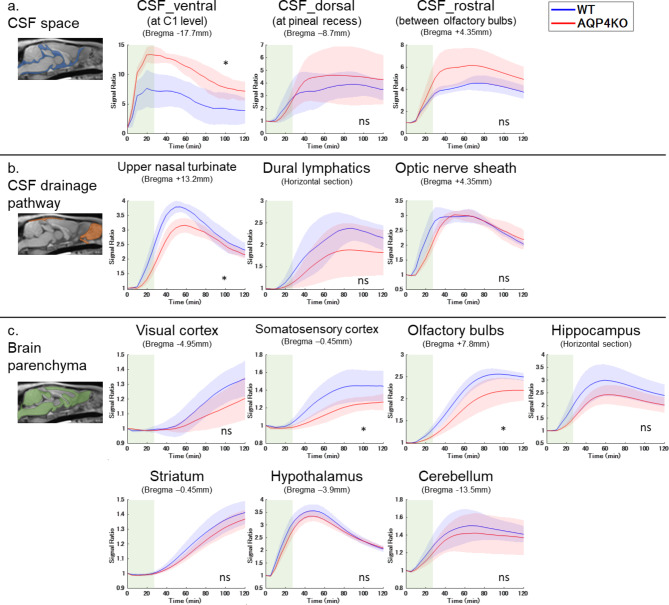
Fig. 5.
TICs of the signal ratio for each ROI in the WT (n = 5) and KO (n = 5) groups for (a) CSF spaces, (b) CSF drainage pathways, and (c) brain parenchyma are presented as mean ± SD. The green area represents approximately 30-minute Gd-tracer injection time. The KO group shows higher signal ratios in the CSF space, particularly on the ventral and rostral sides (a). In contrast, the signal ratios in the CSF drainage pathway and brain parenchyma were lower in the KO group than in the WT group, especially in the upper nasal turbinate, somatosensory cortex, and olfactory bulbs (b and c). *, p < 0.05, by nonparametric Two-way ANOVA; CSF, cerebrospinal fluid; KO, aquaporin 4 knockout; ns, not significant; ROI, region of interest; TIC, time intensity curve; WT, wild type.

