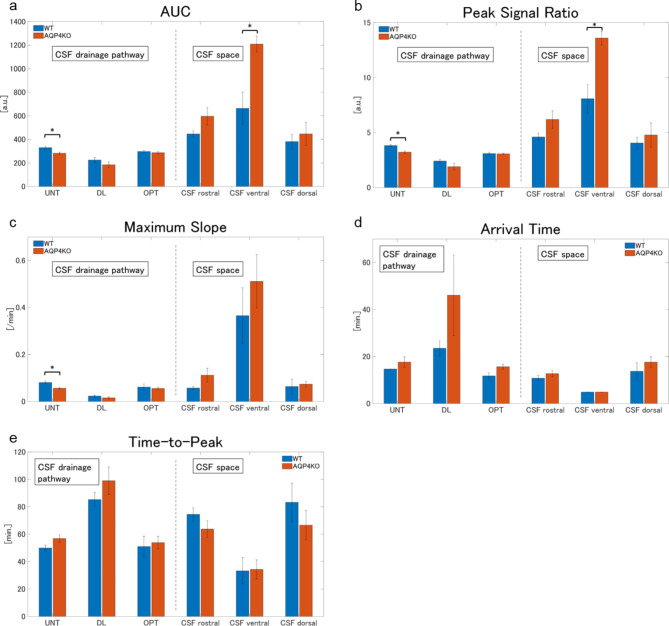
Fig. 6.
Bar plots of TIC kinetic analysis for CSF drainage pathways (left side) and CSF spaces (right side) in the WT (n = 5) and KO (n = 5) groups are presented as mean ± SD. The plots are categorized into AUC (a), PS (b), MS (c), AT (d), and TTP (e). In the KO group, the AUC and MS were higher in each CSF space than those in the WT group; in contrast, they were lower in the CSF drainage pathways, especially the UNT (a and c). The KO group had a significantly higher PS in the ventral CSF space than the WT group, although the PS was lower in the UNT group (b). The AT and TTP of the CSF drainage pathway were longer in the KO group than in the WT group, but the differences were not significant (d and e). *, p < 0.05, by the Mann–Whitney U test after multiple comparison correction; AUC, area under the curve; AT, arrival time; CSF, cerebrospinal fluid; DL, dural lymphatics; KO, aquaporin 4 knockout; MS, maximum slope; OPT, optic nerve; PS, peak signal ratio; UNT, upper nasal turbinate; TTP, time to peak; WT, wild type.

