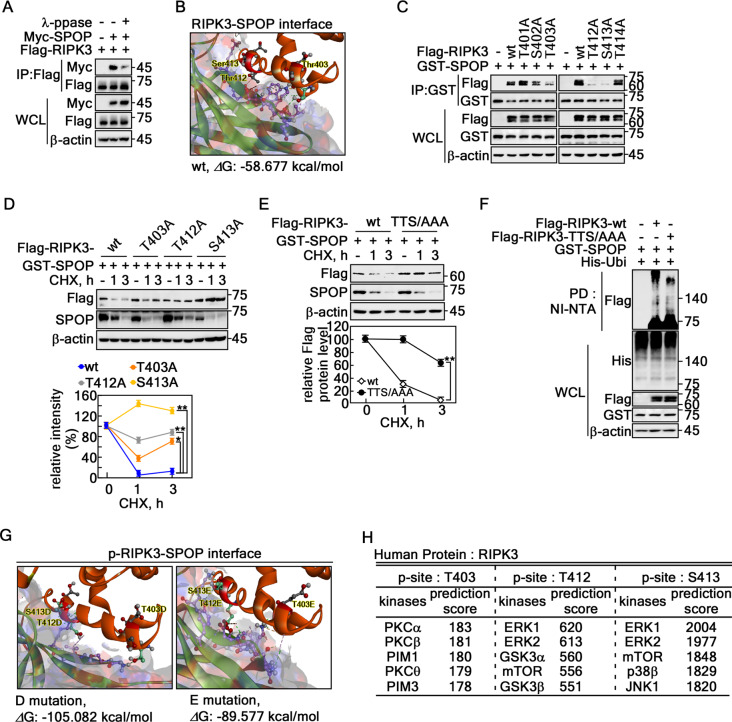
Fig. 4.
Identification of the phospho-degron motifs of RIPK3 for SPOP. A Phosphatase treatment reduced the interaction between SPOP and RIPK3 in HEK293T cells. B Structural model showing the interface of protein–protein docking between SPOP and non-phospho-RIPK3 wildtype; ΔG, docking score indicating docking energy. The full model of (B) is provided in Fig. S3A. The interaction types suggested in (B) are summarized in Supplementary Table 1. C Reduced interactions between SPOP and each degron motif mutant of RIPK3 were observed in HEK293T cells. D Confirmation of the prolonged RIPK3 half-life in degron motif mutants. Upper panels: Each of the degron motif mutants shows a prolonged half-life of RIPK3 after the CHX treatment in HeLa cells. Graphs: The band intensities of RIPK3 were normalized using the β-actin band intensity. Densitometric computer program: NIH Image J (Ver. 1.42). E Upper panels: Confirmation of the prolonged half-life of RIPK3 in the triple mutant of RIPK3 at the degron motifs in HeLa cells. wt, wildtype; TTS/AAA, RIPK3-T403A/T412A/S413A. Graphs: The band intensities of RIPK3 after normalization using the β-actin band intensity. Densitometric computer program: NIH Image J (Ver. 1.42). F Confirmation of the decreased ubiquitination of RIPK3-TTS/AAA in HEK293T cells. G Illustration showing the binding interface between SPOP and D or E mutant of RIPK3 (mimetic of phospho-degron motifs of RIPK3). H Web-based prediction of kinases to phosphorylate RIPK3 at the degron motifs. D and E The error bars from three independent experiments indicate the SEM. * p < 0.05; ** p < 0.01 (Student t-test)

