
Figure 3. Molecular features that strongly differentiate between human antibodies with high and low polyreactivity.
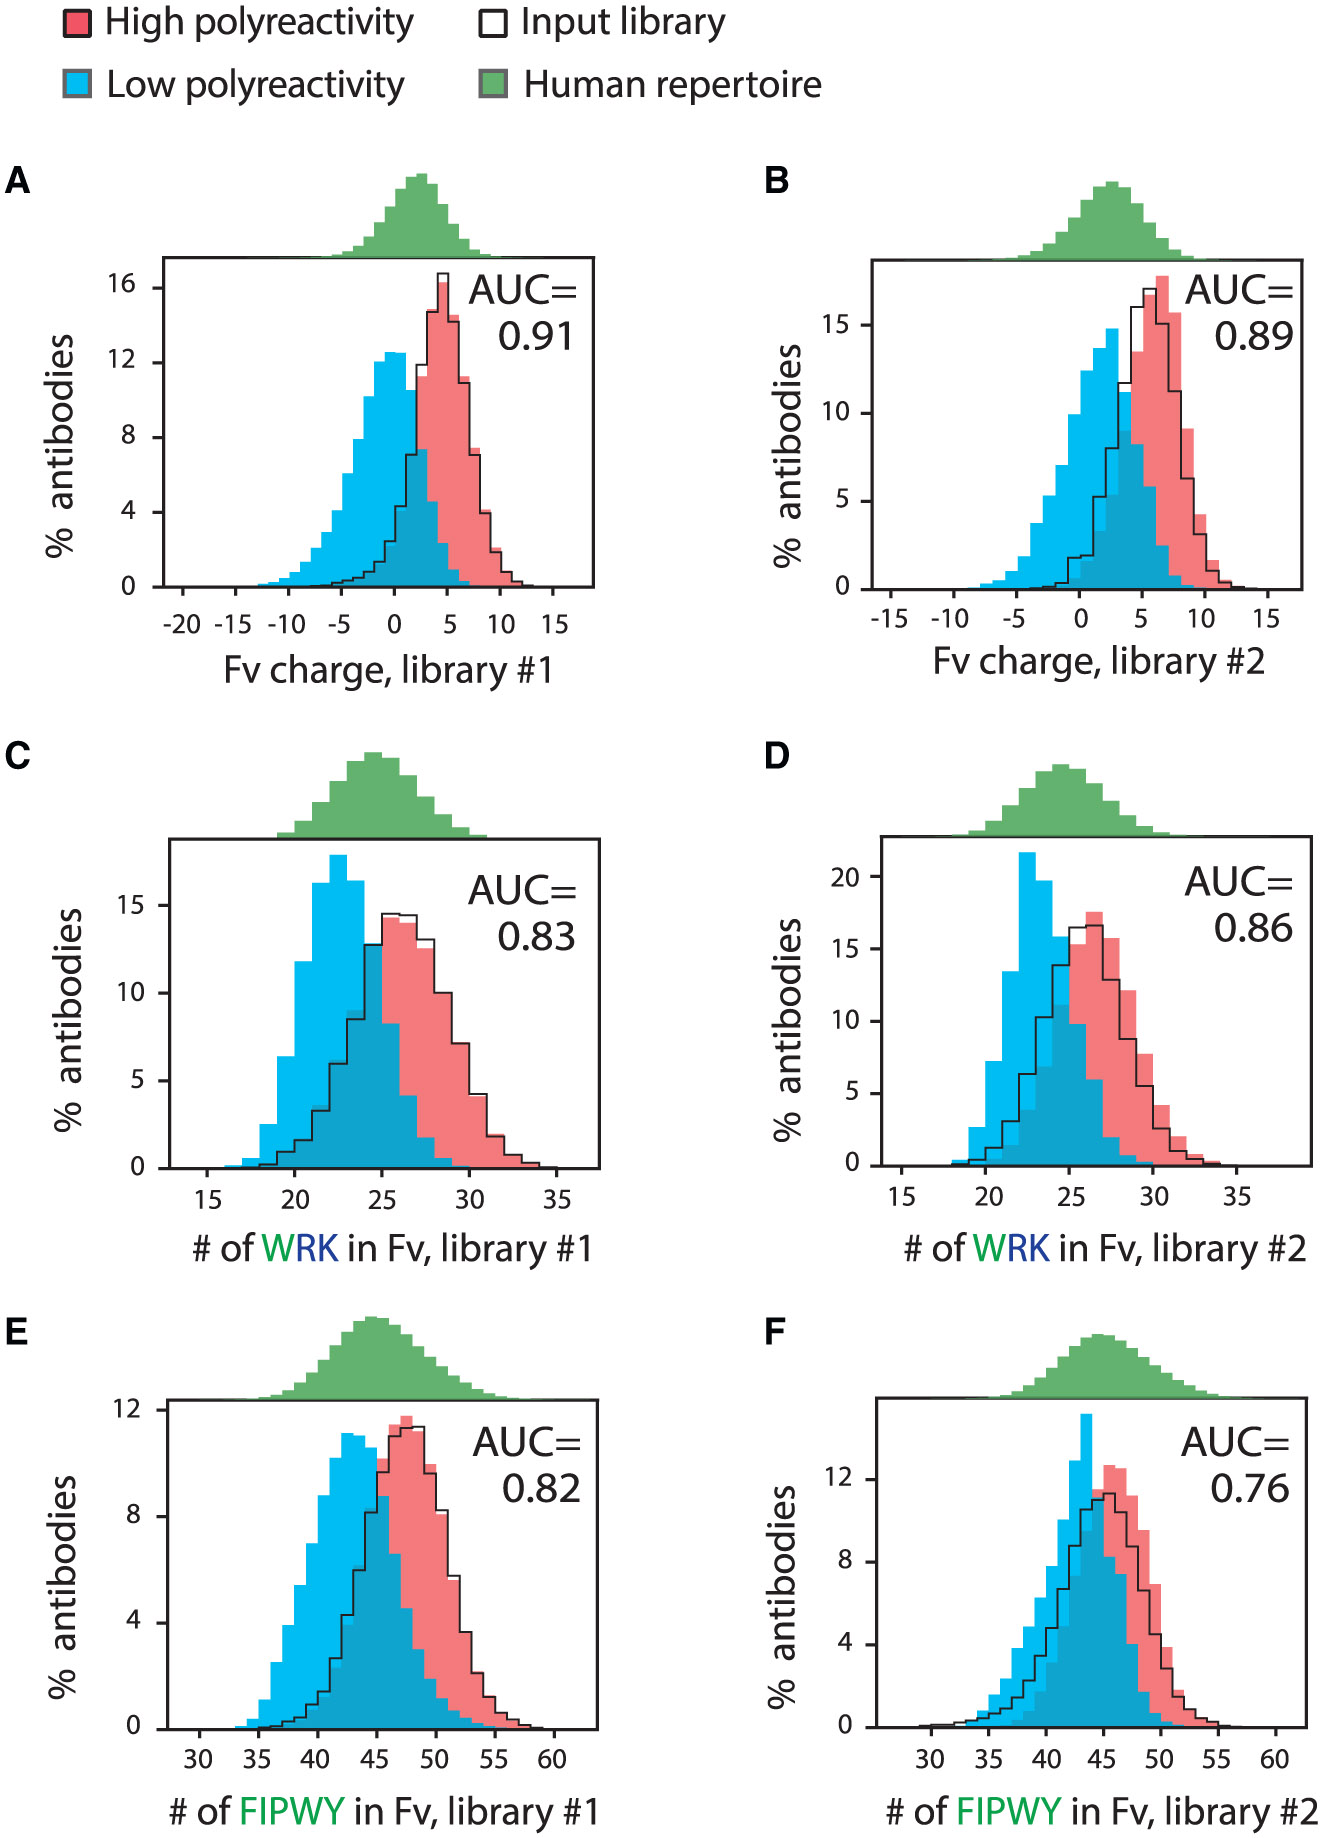
Distributions of key molecular features linked to polyreactivity for human antibodies (libraries #1 and #2) and their corresponding area under the ROC curve (AUC) values calculated using logistic regression analysis. The same features for the input antibody libraries and a human repertoire dataset were also calculated.
(A and B) Fv charge (pH 7.4) distribution for (A) library #1 and (B) library #2.
(C and D) Distributions of the number of tryptophan, arginine, and lysine residues in Fv for (C) library #1 and (D) library #2.
(E and F) Distributions of the number of phenylalanine, isoleucine, proline, tryptophan, and tyrosine residues in Fv for (E) library #1 and (F) library #2.
In (A) and (B), the net charge (pH 7.4) was calculated using charges of +1 for Arg and Lys, +0.1 for His, and −1 for Asp and Glu.