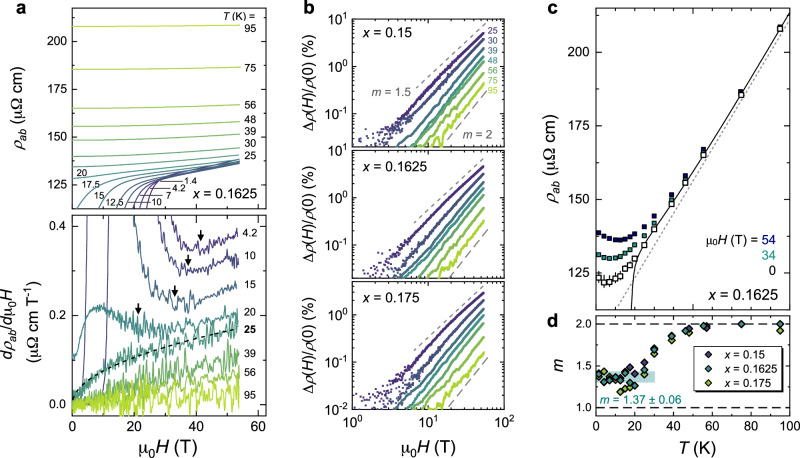
Fig. 3. High-field magnetoresistivity near optimal doping.
a Magnetoresistivity isotherms (top panel) and corresponding field-derivatives (bottom panel) for x = 0.1625. Arrows mark the field strengths above which dρab/dH increases with H, signalling the recovery of normal-state behaviour. Note that the dρab/dH traces plotted here are not vertically shifted. Dashed line overlaying the 25-K derivative is a fit using Δρ(H) = βHm with m = 1.48 ± 0.01. b Fractional MR = [ρ(H) − ρ(0)]/ρ(0) versus H on a log-log scale for specified x. The lower and upper dashed lines denote a H2 and H1.5 dependence, respectively. c ρab(T) for x = 0.1625. Open symbols are the extrapolated zero-field resistivity from the high-field data (see extrapolation details in Supplementary Fig. 7). A superlinear-in-T behaviour is found below ≲ 50 K down to T0(H), as seen from a deviation from the high-T T-linear behaviour illustrated by the grey dashed line. d Power-law exponent m of the MR H-dependence versus T. m values are extracted by fitting the MR curves within the field range in which normal-state behaviour is recovered (Fig. Supplementary Fig. 7). m evolves from 2 at T≥50 K to a low-T plateau at 1.37 ± 0.06 (green shading) for all x ≈ xopt.

