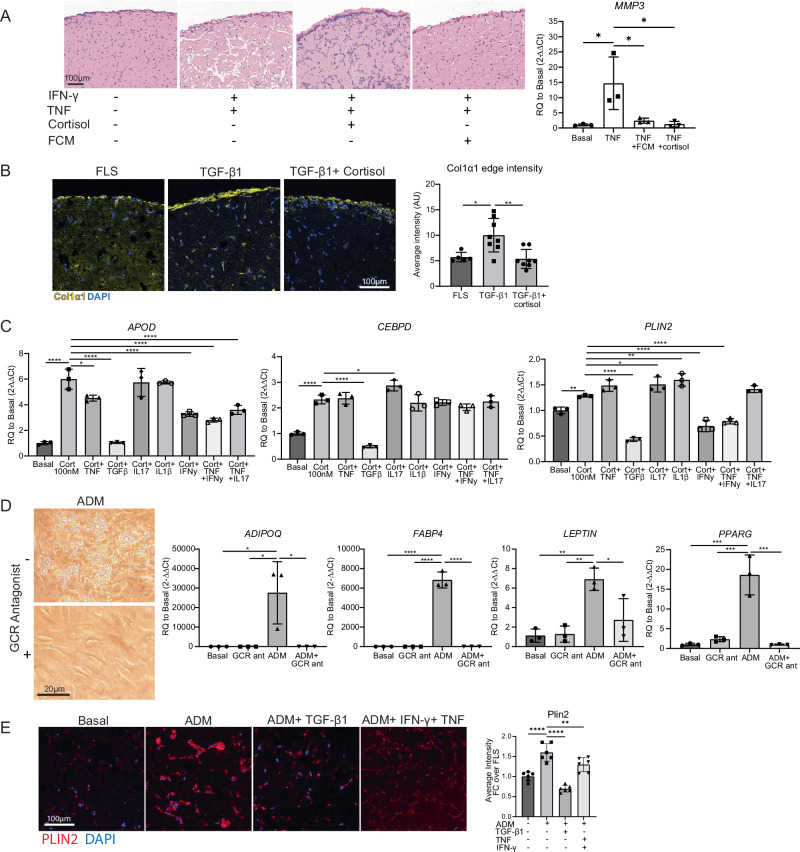
Fig. 7. Functional effect of cortisol on fibroblasts.
A Left: FCM and cortisol (1 µM) protect against TNFa (2 ng/mL) and IFNy (25 ng/mL) induced matrix remodeling in long-term micromass culture (day 17). Cortisol and FCM were not added until day 7 of culture, TNFa and IFNy were added at day 0. n = 3 technical replicates, representative of one independent experiment. Right: MMP3 expression in 2D cultured synovial fibroblasts 24 h after addition of stimulation. n = 3 technical replicates, representative of one independent experiment. B Cortisol (1 µM) prevents TGF-β1 (10 ng/mL) induced fibrosis as measured by collagen 1a1 immunostaining (day 21). ImageJ quantification of COL1A1 staining on the right. FLS n = 5, TGFβ n = 8, TGF-β1+ cortisol n = 8 technical replicates, representative of one independent experiment. C Cortisol (100 nM) was applied to cells along with cytokines and assessed for APOD, CEBPD, and PLIN2 expression after 24 h. Concentrations used were: TNF (2 ng/mL), IFNy (25 ng/mL), TGF-β1 (10 ng/mL), IL1β (2 pg/mL) and IL17 (10 ng/mL). n = 3 technical replicates, representative of one independent experiment. Statistical comparisons: all groups were compared to the cortisol group. D Ability to enter adipogenic programs. Adipocyte differentiation media (ADM) was applied with or without 10 µM mifepristone (GCR antagonist). Day 9 qPCR, day 19 images (cultured until day 28). n = 3 technical replicates, representative of one independent experiment. Two-way ANOVA was performed to calculate statistical significance. E PLIN2 staining of micromass sections. Micromasses were treated with basal media, ADM, or ADM+ cytokines (TGFβ at 10 ng/mL or TNFa at 2 ng/mL+ IFNy at 25 ng/mL). ImageJ quantification of PLIN2 staining is on the right. Statistical comparisons: all groups were compared to the ADM group. n = 3 biological replicates, and two technical replicates within each sample (6 replicates per group total), representative of one independent experiment. A, B Statistical comparisons: all groups were compared to each other. A, B, D, E P values were calculated using an ordinary one-way ANOVA followed by Tukey’s multiple comparisons post hoc test; C P values were calculated using an ordinary one-way ANOVA followed by Dunnet’s multiple comparisons post hoc test. All data are presented as mean ± standard deviation. *P < 0.05, **P < 0.01, ***P < 0.001, ****P < 0.0001. Source data are provided as a Source Data file.

