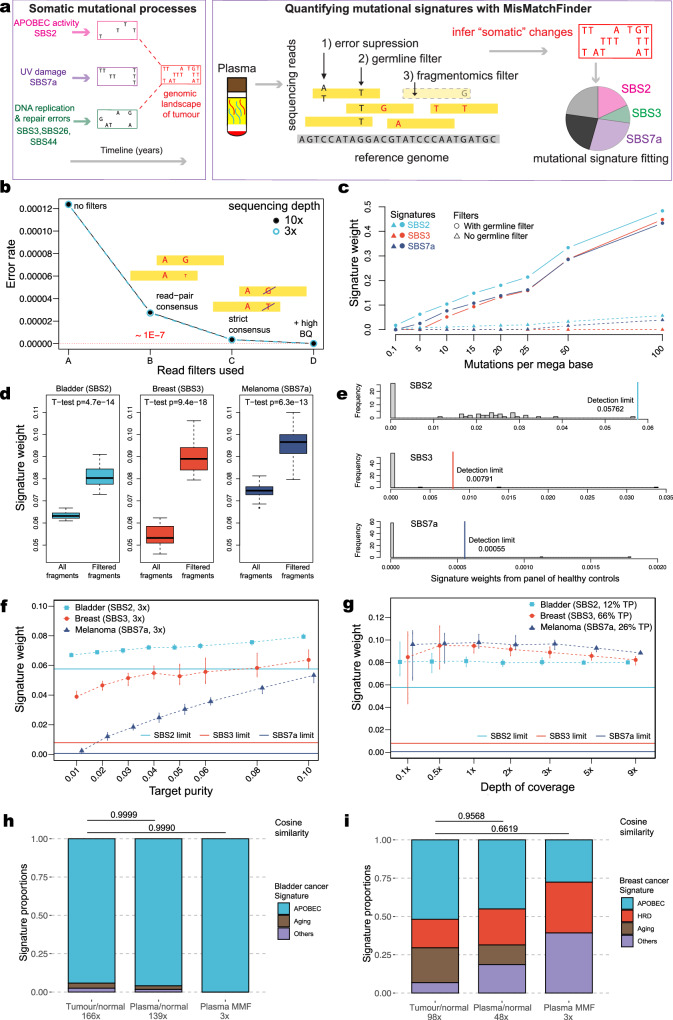
Fig. 1. Description and performance of MisMatchFinder in simulated and clinical sequencing data.
a Schematic describing the MisMatchFinder algorithm for within-sample mutational signature detection in a liquid biopsy context. b Sequencing error rates following distinct filtering approaches applied to LCWGS data simulated to only contain sequencing errors. Error rates are shown after (A) no filters are applied; retaining all mismatches. The following filters are incremental i.e. (C) is a subset of (B) and (D) a subset of (C). (B) Read-pair consensus; retains only mismatches within paired-read overlaps after building consensus for differing base and/or quality, (C) Strict consensus; only retains mismatches that have the same base between paired-reads, and (D) +High BQ; retains mismatches with the same base in both reads with base quality (BQ) ≥ 32. Data are provided in Zenodo [10.5281/zenodo.13845728]. c Effect of gnomAD germline variant filtering on signature detection. Assessed for the APOBEC signature SBS2, the HRD signature SBS3 and the UV-damage signature SBS7a in LCWGS data simulated with varying mutational burdens with depth of coverage fixed at 3×. Source data are provided as a Source Data file. d Effect of the fragmentomics filter to enrich for mismatches originating from ctDNA. Signature weights presented for SBS2, SBS3, and SBS7a, derived from bladder cancer (estimated at 12% tumour purity (TP)), BRCA1-mutant breast cancer (66% TP), and melanoma (26% TP) plasma datasets from three cancer patients. For each cancer type, boxplots represent 20 in silico replicates at 3× sequencing depth. Box plots indicate median (middle line), 25th–75th percentile (box) and 1.5 times the inter-quartile range from the first and third quartiles (whiskers). Outliers were omitted. Two-sided t-tests were performed to compare signature weights using all fragments and using filtered fragments. Source data are provided as a Source Data file. e The distributions of signature weights and detection thresholds (vertical lines) for SBS2, SBS3, and SBS7a from 60 healthy control plasma LCWGS datasets. Source data are provided as a Source Data file. f Effect of tumour purity (TP) in plasma on the limit of signature detection applying all filters and detection limits described in b–e for depth of coverage fixed at 3×. Assessed for signatures SBS2, SBS3 and SBS7a in 20 ctDNA-healthy admixtures from a bladder cancer, a BRCA-mutant breast cancer and a melanoma patient, respectively. For each cancer type, each vertical line represents a boxplot of the signature weights of 20 in silico replicates at different TPs. The bounds of each vertical line are the 25th to 75th percentile and the median signature weights are denoted by the symbols. The horizontal lines denote the detection thresholds per signature type derived from healthy plasma controls. Source data are provided as a Source Data file. g Impact of sequencing coverage on the limit of signature detection applying all filters and detection limits described in b–e for TP at the original levels. Assessed for SBS2, SBS3 and SBS7ain 20 ctDNA-healthy admixtures from bladder cancer, a BRCA1-mutant breast cancer and a melanoma patient, respectively. For each cancer type, each vertical line represents a boxplot of the signature weights of 20 in silico replicates at different depths of coverage. The bounds of each vertical line are the 25th to 75th percentile and the median signature weights are denoted by the symbols. The horizontal lines denote the detection thresholds per signature type derived from healthy plasma controls. Source data are provided as a Source Data file. h Comparison of grouped SBS mutational signatures detected from paired tumour tissue and plasma in a bladder cancer patient. The three columns of signatures were obtained from somatic variants called using 1) high-coverage paired tumour-germline data, 2) plasma-germline data, and 3) variants inferred from low-coverage plasma data (3×) without a germline control using MisMatchFinder (MMF). The signatures assessed were those which have previously been found in bladder cancers1 (APOBEC: SBS2, SBS13; Aging: SBS1, SBS5; and Others: SBS8, SBS29, and SBS40). Pairwise cosine similarities of signature sets from 2) and 3) against the tumour-germline signatures are annotated above the plots. Source data are provided as a Source Data file. i Comparison of grouped SBS mutational signatures detected from paired tumour tissue and plasma in a BRCA1-mutant breast cancer patient. The three columns represent the same groups as for h The signatures assessed were those which have been previously found in breast cancers1 (APOBEC: SBS2, SBS13; HRD: SBS3; Aging: SBS1, SBS5; Others: SBS8, SBS9, SBS17a, SBS17b, SBS18, SBS37, SBS40, and SBS41). Source data are provided as a Source Data file.

