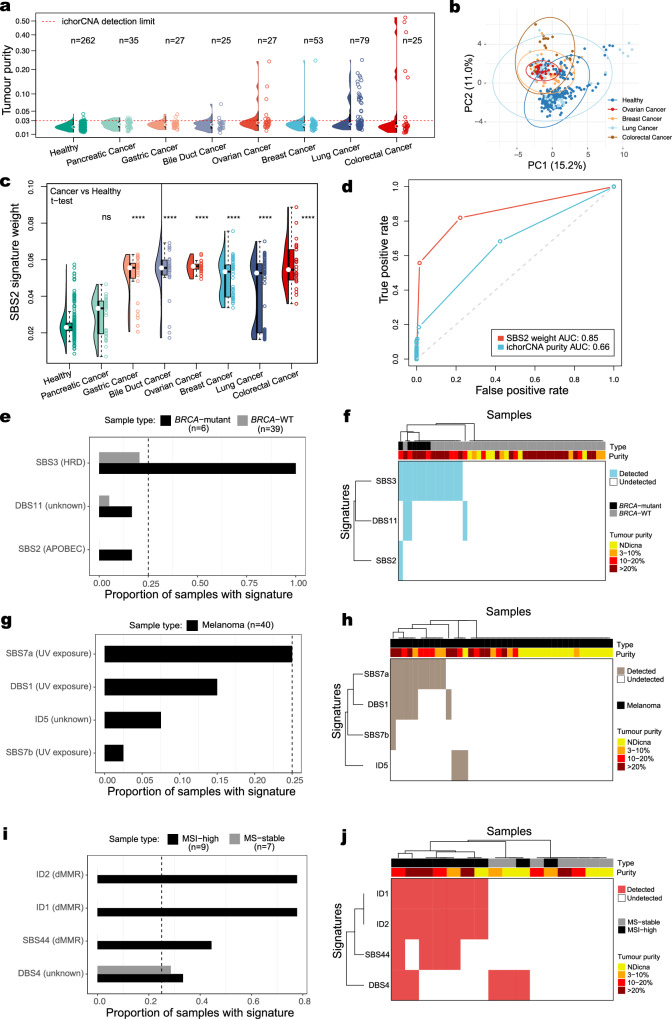
Fig. 2. MisMatchFinder signature analysis for detecting cancer-related and clinically relevant signatures.
a Tumour purity distribution in a pan-cancer plasma cohort comprising 271 samples across 7 cancer types and 262 healthy controls using 1-2x LCWGS. The red dashed line denotes ichorCNA’s detection limit for tumour purity estimation. Source data are provided as Supplementary Data 3. b Principal component analysis of healthy controls against four cancer types with high estimated tumour purity analysed using all SBS signatures excluding those linked to sequencing and library preparation artefacts. Source data are provided as Supplementary Data 3. c Distribution of the APOBEC-enzyme activity linked SBS2 signature weights across the cohort in a. The number of asterisks quantifies the statistically significant difference between each cancer type with the healthy control group using a two-sided t-test (*p ≤ 0.05, **p ≤ 0.01, ***p ≤ 0.001, ****p ≤ 0.0001, ns non-significant). The exact p-values from left to right are: 1, 3.3e-20, 6.9e-31, 5.5e-29, 1.1e-32, 8.1e-24, and 2.0e-28. Box plots indicate median (middle line), 25th to 75th percentile (box) and 1.5 times the inter-quartile range from the first and third quartiles (whiskers). Outliers were omitted. Source data are provided as Supplementary Data 3. d Receiver Operating Characteristic (ROC) curves and area under the curve (AUC) values for discriminating cancer from healthy plasma using tumour purity estimates from a and SBS2 weights from (c). Source data are provided as Supplementary Data 3. e Detection frequency of the top SBS/DBS and indel-based signatures previously found in this cancer type, for 45 breast cancer patients with known BRCA1/2 mutational status. Source data are provided as Supplementary Data 1. f Hierarchical clustering of all samples and signatures in e annotated by their estimated tumour purity in plasma. NDicna relates to samples with TP below the limit of detection of ichorCNA. Source data are provided as Supplementary Data 1. g As in e for 40 patients with melanoma with varying TP. Source data are provided as Supplementary Data 1. h As in f for cohort and signatures in g. Source data are provided as Supplementary Data 1. i As in e for 16 patients with colorectal cancer with known microsatellite instability (MSI) status. Source data are provided as Supplementary Data 2. j As in f for cohort and signatures in i. Source data are provided as Supplementary Data 2.

