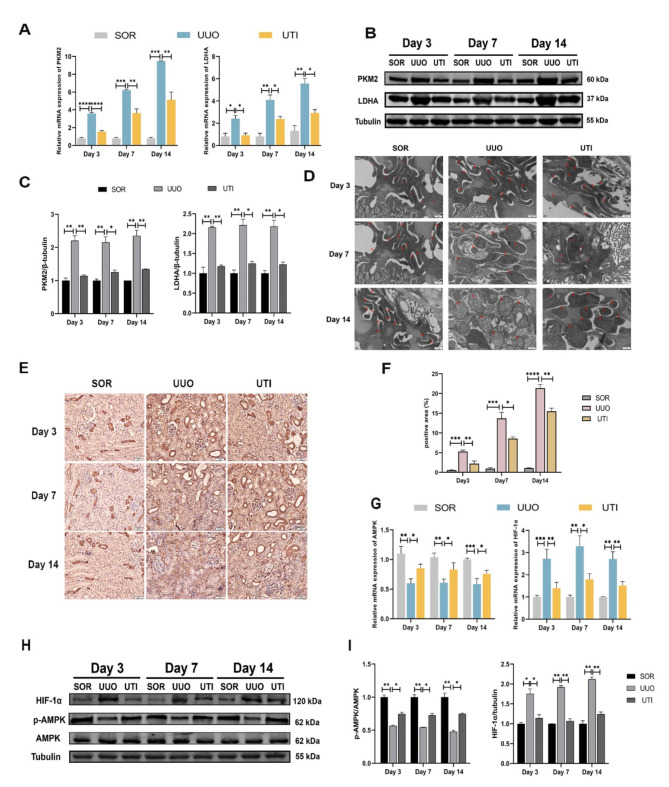
Fig. 3.
UTI blocked the glycolysis process induced by UUO. (A) The expression of PKM2 and LDHA was detected by qPCR (*P < 0.05, **P < 0.01, ***P < 0.001, ****P < 0.0001). (B) The levels of PKM2 and LDHA were detected by Western blot. (C) The grey value results of PKM2 and LDHA. Tubulin was used as the loading control (*P < 0.05, **P < 0.01). (D) Mitochondrial morphology in three groups of mice, red arrows indicate mitochondria (Original magnification: × 20000, scale: 0.5 μm) (E and F) The expression of PKM2 was evaluated by immunohistochemical staining, the positive areas were quantified (Original magnification: × 400, scale: 20 μm, *P < 0.05, **P < 0.01, ***P < 0.001, ****P < 0.0001). (G) The expression of AMPK and HIF-1α was detected by qPCR (*P < 0.05, **P < 0.01, ***P < 0.001). (H) The levels of AMPK, p-AMPK and HIF-1α were detected by Western blot. (I) The analysis of grey value of p-AMPK and HIF-1α. AMPK and Tubulin were used as the loading controls (*P < 0.05, **P < 0.01). Results were presented as mean ± SD of three individual experiments. The full-length blots/gels are presented in Supplementary Fig. 1 and Fig. 3.

