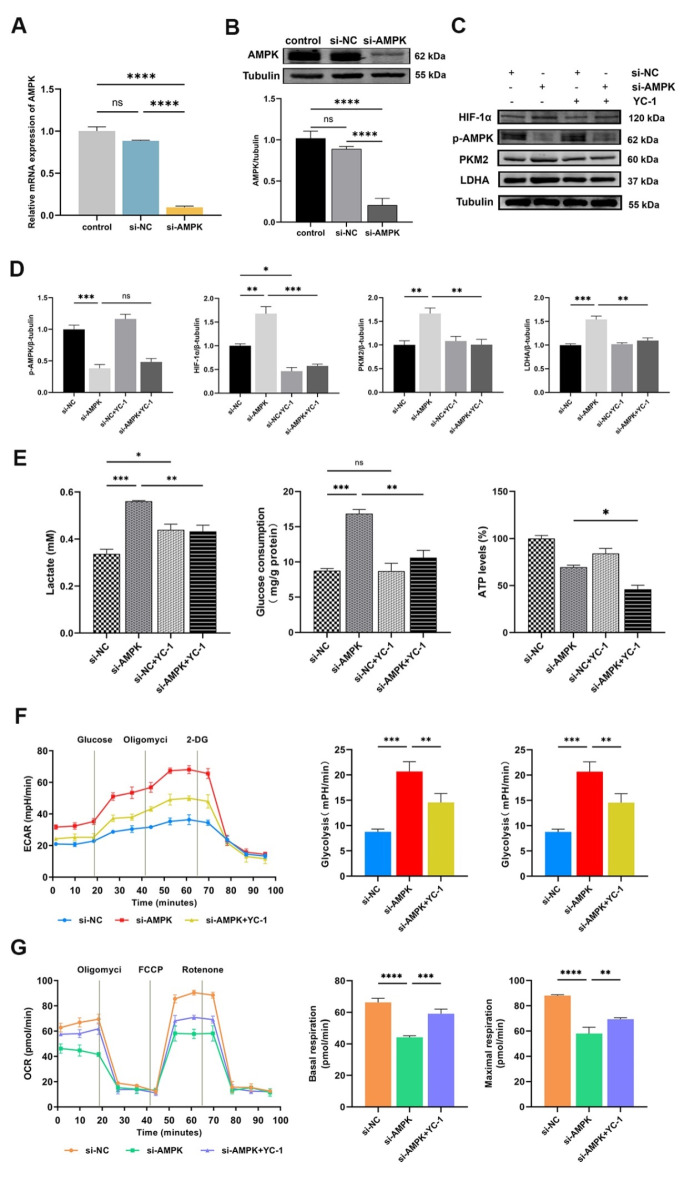
Fig. 5.
Inhibition of the AMPK/HIF-1α pathway activates glycolysis in HK-2 cells. (A and B) The transfection efficiency of AMPK was evaluated by qPCR and Western blot, respectively (ns for P > 0.05, ****P < 0.0001). (C and D) Western blot was performed to determine the levels of p-AMPK, HIF-1α, PKM2, and LDHA. The intensity of the bands was quantified using Image J software. Tubulin was used as the loading control (ns for P > 0.05, *P < 0.05, **P < 0.01, ***P < 0.001). (E) The levels of lactate in cell medium, glucose and ATP in the cell lysates treated with AMPK knockdown and/or YC-1 (ns for P > 0.05, *P < 0.05, **P < 0.01, ***P < 0.001). (F and G) The ECAR and OCR were detected in HK-2 cells that received si-AMPK and/or YC-1. Quantify the glycolysis rate, glycolytic capacity, basal respiration and maximal respiration (**P < 0.01, ***P < 0.001, ****P < 0.0001). Results were presented as mean ± SD of three individual experiments. The full-length blots/gels are presented in Supplementary Figs. 7–8.

