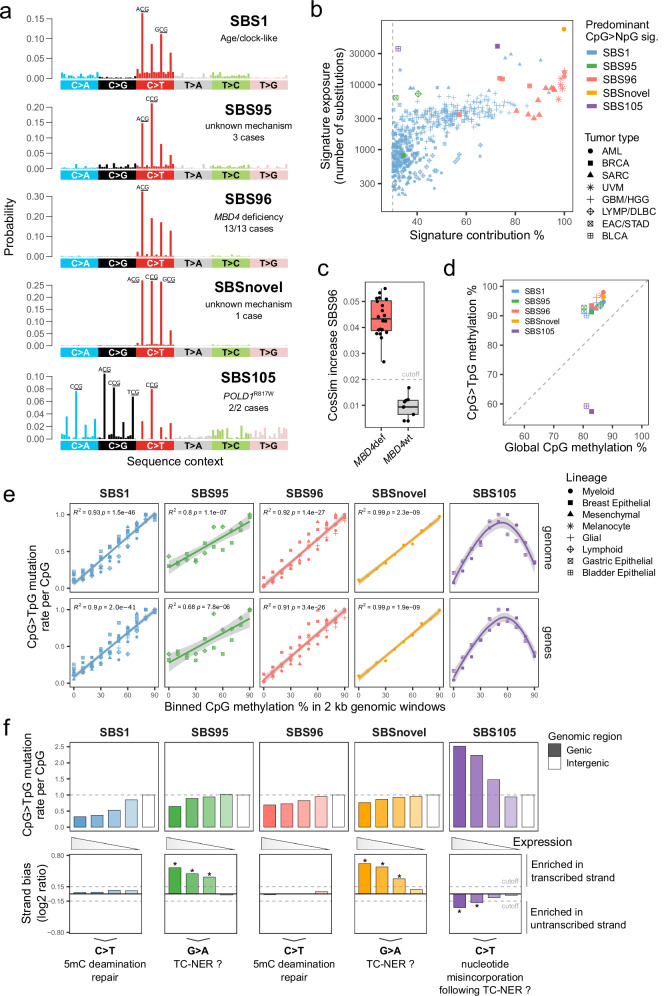
Fig. 1. Refining the spectrum of CpG mutational signatures and their dependence on 5mC deamination.
a Substitution profiles by trinucleotide sequence context (96-channel) of SBS reference mutational signatures characterized by a high frequency of CpG>NpG substitutions. The most frequent substitutions per signature are indicated. b Scatter plot of exposures to predominant CpG>NpG mutational signature found per tumor sample, as absolute exposure versus percent exposure contribution. The dashed line indicates the 30% contribution cutoff used to select SBS1 samples. AML, acute myeloid leukemia; BRCA, breast invasive carcinoma; SARC, sarcoma; UVM, uveal melanoma; GBM, glioblastoma multiforme; HHG, high-grade glioma; LYMP, lymphoid neoplasm; DLBC, diffuse large B-cell lymphoma; EAC, esophageal adenocarcinoma; STAD, stomach adenocarcinoma; BLCA, bladder urothelial carcinoma. c Distributions of cosine similarity increase for signature fitting with rare SBS96 compared to common signatures only, per tumor sample. MBD4def, MBD4-deficient (n = 20); MBD4wt, MBD4 wild-type (n = 9). The dashed line indicates the standard cutoff of FitMS in cosine similarity increase multistep mode. Boxes indicate the median, 25th and 75th percentiles. Whiskers extend to the largest or lowest value up to 1.5 times the distance between the 25th and 75th percentiles. d Scatter plot of DNA methylation percentages in CpG > TpG mutated sites versus all CpGs (global), per signature and cell lineage. Methylation was interrogated in data from normal human cell types. The dashed line indicates the absence of over- or under-representation of methylation in mutated CpGs. e Scatter plots of CpG > TpG mutation rates per CpG of different tumor types and signatures in 2 kb genomic windows grouped by their mean CpG methylation levels. Mutation rates were normalized by the highest value in each tumor type. The lines indicate data fitting with linear regression models or smoothed conditional means models. Two-sided Pearson correlation statistics are shown. Shaded areas represent the 95% confidence intervals. f Bar plots of CpG > TpG mutation rates per CpG in genic or intergenic regions (upper panel). Transcriptional strand asymmetry of CpG > TpG mutations in genic regions (lower panel). Genes were grouped based on expression level quartiles. Asterisks mark a significant difference in contribution between transcribed and untranscribed strands (see “Methods”). The dashed line indicates the cutoff used to assign significance. Source data are provided as a Source Data file.

