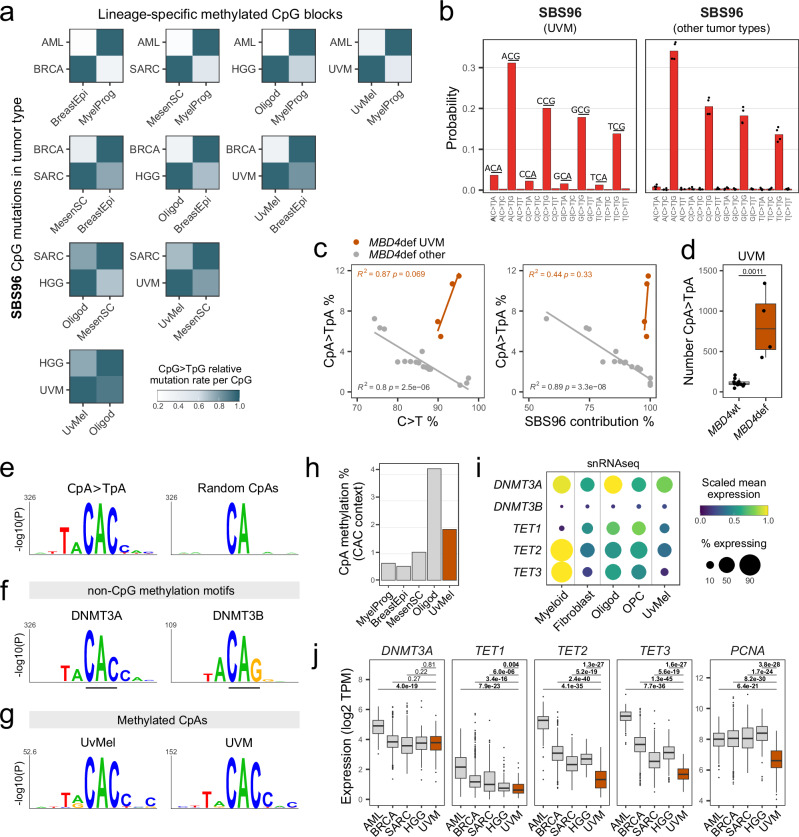
Fig. 3. SBS96 recapitulates lineage-specific CpG and non-CpG methylation landscapes.
a Heatmaps of SBS96 relative CpG > TpG mutation rates in CpG blocks differentially methylated between normal cell type pairs. Hypermethylated blocks are indicated in the x-axis, and tumor types in the y-axis. Values are normalized per tumor type. b C > T substitution profiles by trinucleotide context of tumor type-specific SBS96. Bars represent means in UVM (n = 1) or other tumor types (n = 4; AML, BRCA, SARC, and HGG). c Scatter plots of CpA>TpA substitution percentages versus all C > T substitutions percentages or SBS96 percentage contribution in MBD4-deficient (MBD4def) tumors. Lines indicate data fitting with linear regression models. Two-sided Pearson correlation statistics are shown. d Distributions of the absolute number of CpA > TpA substitutions in UVM tumors MBD4def (n = 4) or MBD4 wild-type (MBD4wt; n = 12). Two-sided Wilcoxon test P-value is indicated. Boxes indicate the median, 25th and 75th percentiles. Whiskers extend to the largest or lowest value up to 1.5 times the distance between the 25th and 75th percentiles. e Sequence probability logos around CpA > TpA mutated sites in MBD4def UVM and of an equal number of randomly interrogated CpA sites (n = 2823). f Sequence probability logos around top non-CpG methylated sites in Dnmt triple-knockout mouse embryonic stem cells with ectopic reintroduction of Dnmt3a (n = 1000) or Dnmt3b (n = 189). g Sequence probability logos around methylated CpA sites in uveal melanocytes (UvMel) and uveal melanomas (UVM). Logos in panels e-g were generated with kpLogo and Bonferroni corrected P-values are shown. h CpA methylation percentages in CAC context in normal cell types. i Dot plot of single-nuclei RNAseq data of the posterior human eye. Dot size indicates the percentage of nuclei expressing each gene. j Distributions of gene expression in TCGA tumors, including AML (n = 151), BRCA (n = 1231), SARC (n = 265), HGG (n = 175) and UVM (n = 80). Values are expressed as transcripts per million (TPM). Two-sided Wilcoxon test P-values without multiple comparisons adjustment are indicated. Statistics of boxes and whiskers are described above. AML, acute myeloid leukemia; BRCA, breast invasive carcinoma; SARC, sarcoma; HHG, high-grade glioma; MyelProg, common myeloid progenitor; BreastEpi, breast luminal epithelium; MesenSC, mesenchymal stem cell; Oligod, oligodendrocyte; OPC, oligodendrocyte precursor cell. Source data are provided as a Source Data file.

