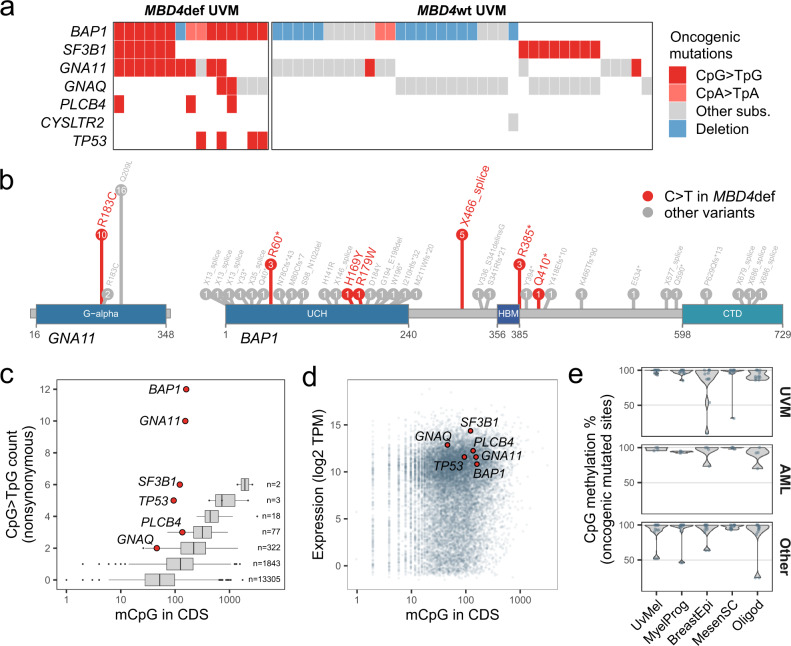
Fig. 4. SBS96 targets tumor-specific driver genes.
a Oncoplot of oncogenic mutations in uveal melanoma (UVM) cases by MBD4 status. MBD4def, MBD4-deficient; MBD4wt, MBD4 wild-type. Tumor samples from the same individual showing identical mutational patterns were combined. b Oncogenic mutations in GNA11 and BAP1 found in UVM tumors. Amino acid positions are derived from mutation positions in the transcript. The values in circles indicate the number of cases harboring each mutation. Protein domains are shown in blue. c Distribution of the number of methylated CpGs (mCpGs) in the coding sequence (CDS) per gene, grouped by the total number of nonsynonymous CpG>TpG mutations observed among MBD4def UVM. Key UVM drivers are shown as red dots and other genes are shown as boxplots. The number of genes per boxplot is shown. Boxes indicate the median, 25th and 75th percentiles. Whiskers extend to the largest or lowest value up to 1.5 times the distance between the 25th and 75th percentiles. d Scatter plot of gene expression values expressed as transcripts per million (TPM) versus the number of mCpGs in the CDS, per gene. Key UVM drivers are shown as red dots. e Distribution of CpG methylation percentages among normal cell types for CpG > TpG oncogenic mutations, separated by tumor type. Source data are provided as a Source Data file.

