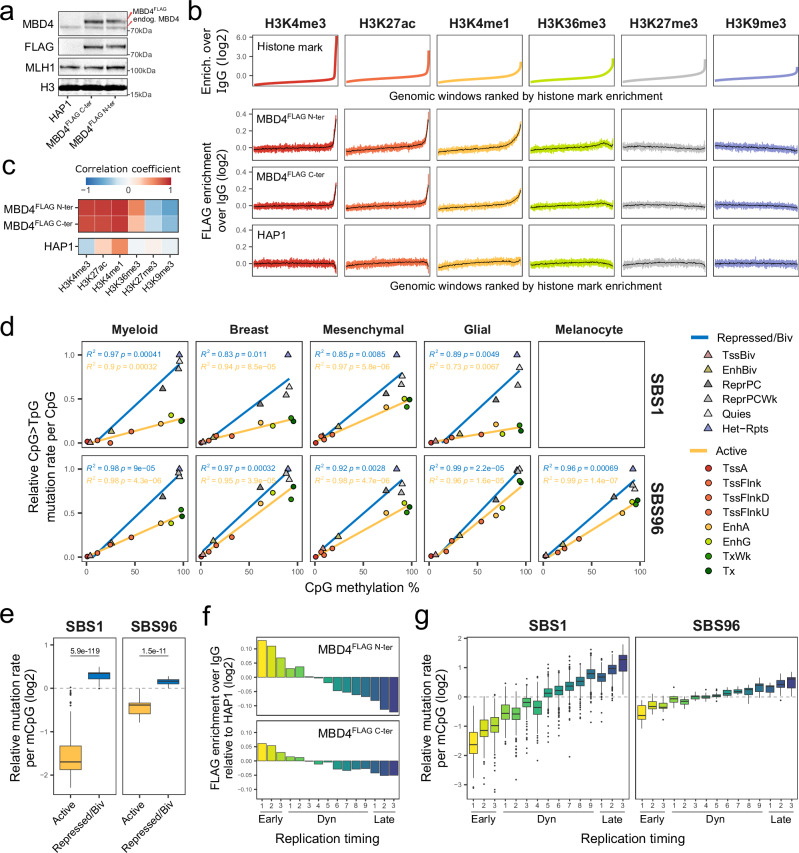
Fig. 5. MBD4 preferentially protects active chromatin and early replicating DNA.
a Western blotting on nuclear extracts of parental HAP1 cells or clones overexpressing C- or N-terminally FLAG-tagged MBD4. Exogenous and endogenous MBD4 bands and positions of molecular weight markers are indicated. No replication attempt was performed. b Histone mark enrichment over IgG in 2 kb genomic windows, ranked from lowest to highest enrichment (upper panel). FLAG enrichment over IgG in the corresponding genomic windows (lower panel). Means of every 400 or 8000 similarly-ranked windows are shown in colored shades or black, respectively. c Heatmap of Pearson correlation coefficients between histone marks and FLAG enrichment, obtained from the means of every 400 similarly-ranked windows. d Scatter plots of CpG > TpG mutation rates per CpG versus mean CpG methylation levels in chromatin states. Tumor mutations and normal epigenomic data are grouped by lineage. Mutation rates were normalized by the highest value per tumor, and the means of all tumors per lineage are shown. Lines indicate data fitting with linear regression models. Two-sided Pearson correlation statistics are shown. TssA, active TSS; TssFlnk/TssFlnkD/TssFlnkU, flanking TSS; EnhA/EnhG, active/genic enhancer; Tx/TxWk, strong/weak transcription; TssBiv, bivalent/poised TSS; EnhBiv, bivalent enhancer; ReprPC/ReprPCWk, strong/weak repressed polycomb; Quies, quiescent/low; Het-Rpts, heterochromatin/ZNF genes and repeats. e Distributions of CpG > TpG mutation rates per methylated CpG (mCpG) in SBS1 (n = 359) and SBS96 (n = 20) tumors in active or repressed/bivalent chromatin states. Observed relative to expected mutation rates are shown, considering an expected random distribution of CpG > TpG mutations among mCpGs. Two-sided Wilcoxon test P-values are indicated. Boxes indicate the median, 25th and 75th percentiles. Whiskers extend to the largest or lowest value up to 1.5 times the distance between the 25th and 75th percentiles. f Signal enrichment of FLAG-tagged MBD4 in replication timing annotations, relative to FLAG enrichment in parental HAP1 cells. Early, constitutive early; Dyn, dynamic; Late, constitutive late. g Distributions of CpG > TpG mutation rates per mCpG in SBS1 (n = 442) and SBS96 (n = 20) tumors in replication timing annotations. Observed relative to expected mutation rates are shown, considering an expected random distribution of CpG > TpG mutations among mCpGs. Statistics of boxes and whiskers are described above. Source data are provided as a Source Data file.

