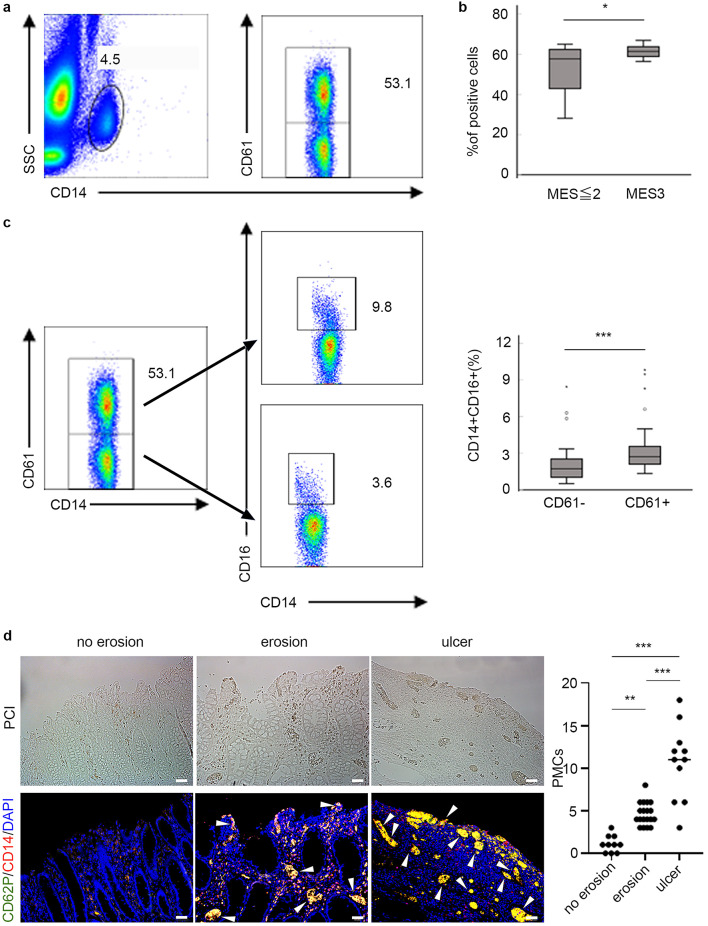
Fig. 4.
Correlation of platelet–monocyte complex with endoscopic severity. (a) Dot plots represent the gating strategy of the PMCs. PMCs were identified in whole blood based on their FSC, CD14, and CD61 positivity. (b) The proportion of CD14+ platelets in peripheral blood from patients UC having MES ≤ 2 (n = 26) and MES3 (n = 26) was determined using flow cytometry. (c) Dot plots show representative patterns of monocytes with (upper) and without (lower) platelets (left), and their CD16 expression (middle). The bar graph (right) shows significant upregulation of CD16 in PMCs compared with that in unconjugated platelets in patients with UC (n = 52). P-values were calculated using the Mann–Whitney U test: *P < 0.05, ***P < 0.001. PMC, platelet–monocyte complex. (d) Immunofluorescence staining was performed to compare the presence of PMCs as CD62P + platelets aggregation (green) with CD14 + monocytes (red) among no erosion (left), erosion within mucosal layer (middle), and ulceration reaching submucosal layer (right). The dot plot illustrates the number of PMC in colon mucosa. Data were derived from randomized views (×200) (no erosion; n = 10, erosion; n = 19, ulcer; n = 11) from 9 independent surgical specimens. P-values were calculated using the Tukey’s multiple comparison test: **P < 0.01, ***P < 0.001. Arrowheads indicate PMCs. Bars indicate 50 μm. PCI, phase contrast image. DAPI, 4’,6-diamidino-2-phenylindole.

