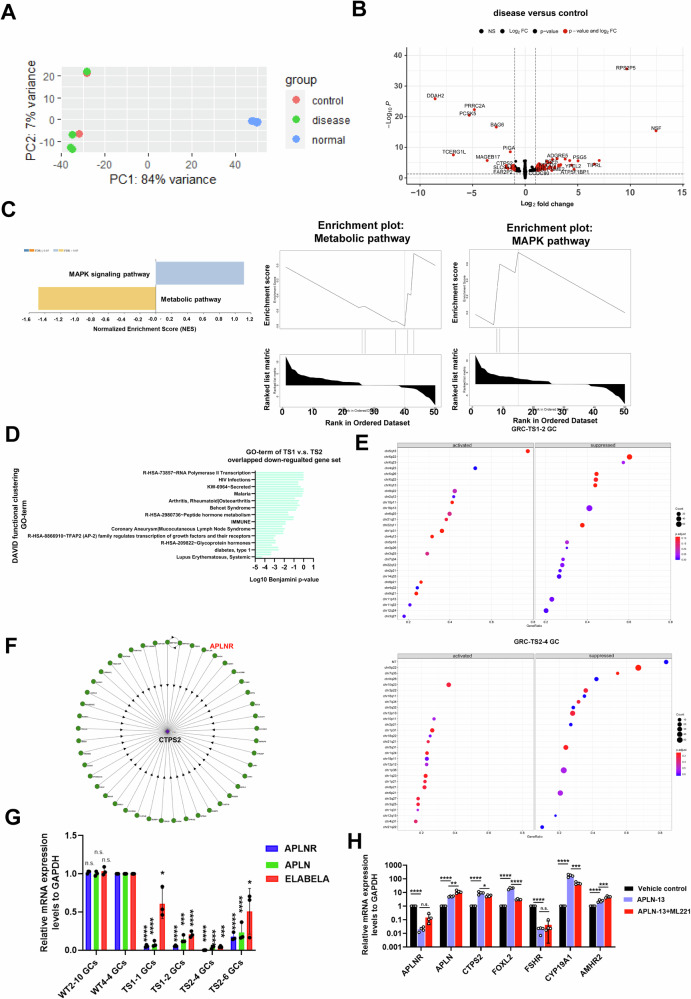
Fig. 3. RNA-seq analysis of iPSC-derived GCs reveals disruption of immune associated pathways and metabolic pathways.
A A principal component analysis (PCA) plot showing separation of the control (WT-GCs: WT2-10, WT4-4), disease (TS-GCs:TS1-1, TS1-2, TS2-4, TS2-6), and normal (luteinized cumulus cells from four doners) GCs samples at differentiation day 12. B Volcano plot showing the differentially expressed genes comparing GCs from control and disease samples. Red dots represent genes with |log2(fold-change)| >1 and padj < 0.05. The two control iPSC line clones are derived from two unaffected donors, while disease iPSC line clones are derived from two independent patient donors. Two biological replicates are shown for each condition. C Gene Set Enrichment Analysis (GSEA) identifying enriched pathways in metabolic pathway with gene set enrichment at the bottom of the ranked list. While a positive normalized enrichment score (NES) indicates gene set enrichment at the top of the ranked list showed MAPK pathway enrichment. NES is the normalized enrichment score to account for the size of each gene set. D Bar plot showing enriched gene ontology (GO) terms using DAVID functional annotation analysis for downregulated genes common between GCs derived from TS1 iPSC lines and TS2 iPSC line compared to control lines. E GESA analysis based on gene sets in MSigDB databased on C1 category (corresponding to human chromosome cytogenetic bands) in GRC-TS1-2 GCs and GRC-TS2-4 GCs, separately. F Illustration of CTSP2 protein interaction map. G qRT-PCR analysis to quantified APLNR, APLN, ELABELA expression in control-GCs and TS-GCs. Error bars indicate the mean ± SD (n=3). One-way ANOVA with a Dunnett post hoc test was performed. Multiple comparisons between TS-GCs vs. WT4-4 GCs. *p < 0.05, ***p < 0.001, and ****p < 0.0001. H qRT-PCR analysis was performed to determine the mRNA levels of target genes after APLN-13 treatments (20 μM) or with ML221 (10 μM) from differentiation day 5 to day 12. Error bars indicate the mean ± SD (n = 4). Unpaired Student’s t test was performed. *p < 0.05, **p < 0.01, ***p < 0.001, and ****p < 0.0001.

