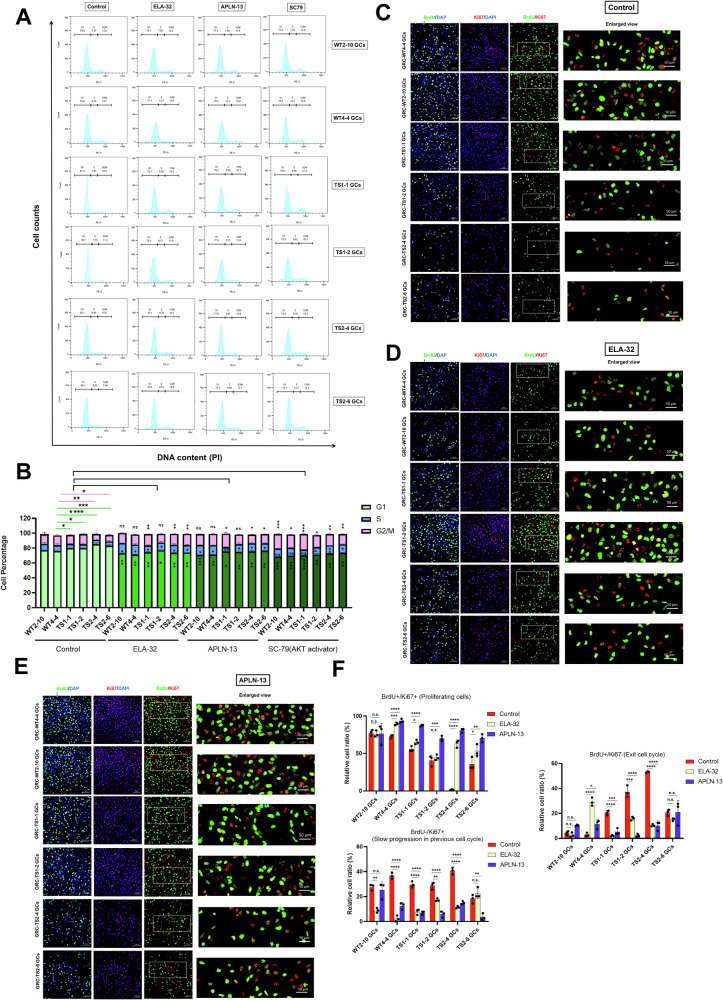
Fig. 4. Apelin signaling can partially restore the cell growth and cell division defects in TS-GCs.
A Cell cycle analysis using PI staining were performed in WT control GCs and TS-GCs. B The quantification of cell percentages in each cell cycle in G1, S, and G2/M phases. Error bars indicate the mean ± SD (n = 3). One-way ANOVA with a Dunnett post hoc test was performed. n.s. not significant, *p < 0.05, **p < 0.01, ***p < 0.001, and ****p < 0.0001 vs. GRC-WT4-4 GCs. Representative fields of colocalization of anti-BrdU (green color) and anti-Ki67 (red color) staining results in vehicle control (C), treatment with ELA-32 (D), and treatment with APLN-13 (E). F Relative cell ratio in percentage rate in each treatment condition were calculated as proportions of the total signal in green and red channel (in BrdU+Ki-67+ panel) or DAPI signal (in BrdU+Ki-67− and in BrdU-Ki-67+ panel). Proliferating cells are cells labeled with both Ki-67 and BrdU, while non-proliferating cells were labeled with only DAPI. Cells exiting the cell cycle were labeled with BrdU but not Ki-67. Error bars indicate the mean ± SD (n = 3). One-way ANOVA with a Dunnett post hoc test was performed. Multiple comparisons between treatment vs. control group. n.s. not significant, *p < 0.05, **p < 0.01, ***p < 0.001, and ****p < 0.0001.

