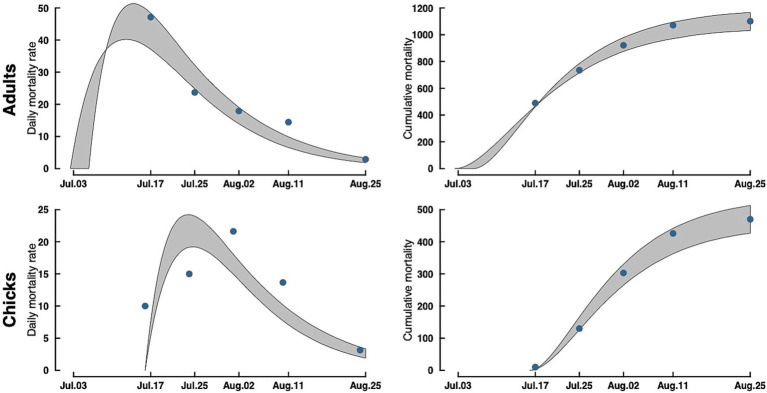
Figure 3.
Adult (top) and chick (bottom) Caspian tern daily mortality rates (left) and cumulative mortality (right) during the 2023 Rat Island H5N1 HPAI virus event. Gray bands are a 95% CrI around the estimate. Dots in the accumulation curves represent the observed cumulative removals from the Island. The dots in the mortality rate curves are the actual counts of carcasses removed rescaled to daily mortalities (observed counts/ave. time difference between collections).

