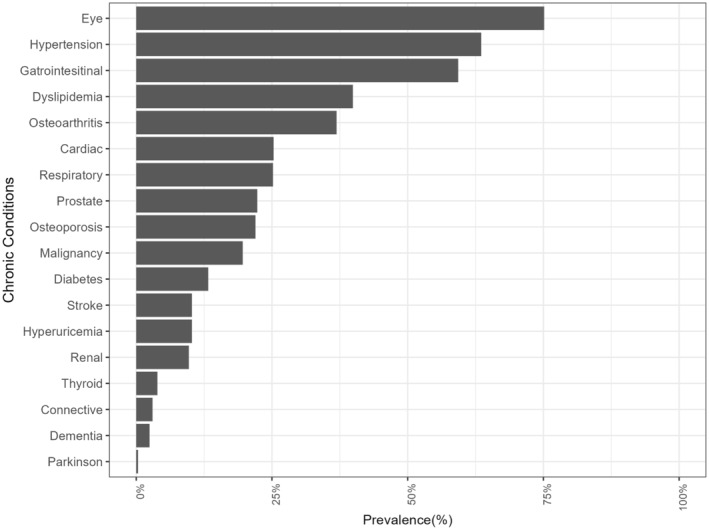
FIGURE 2.

Prevalence of each chronic condition among analyzed participants. This figure illustrates the prevalence of various chronic diseases within the analyzed cohort. Past medical history was obtained not from claims data but through direct interviews by physician. Each chronic disease is represented on the horizontal axis, while the vertical axis displays the prevalence rate (percentage).
