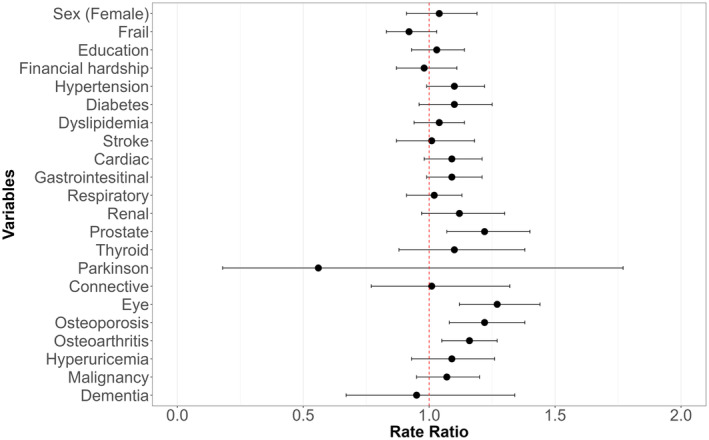
FIGURE 4.

Result of multivariate Poisson regression analysis for higher regularly visited facility (RVF). This figure delineates the results from a multivariate Poisson regression analysis with the RVF as the dependent variable. This adjusted model includes gender, frailty, education, financial hardship, and the presence of each condition. The horizontal axis indicates the rate ratios that represent the expected change in the RVF for each increment of one in the associated factors, while controlling for all other variables in the model.
