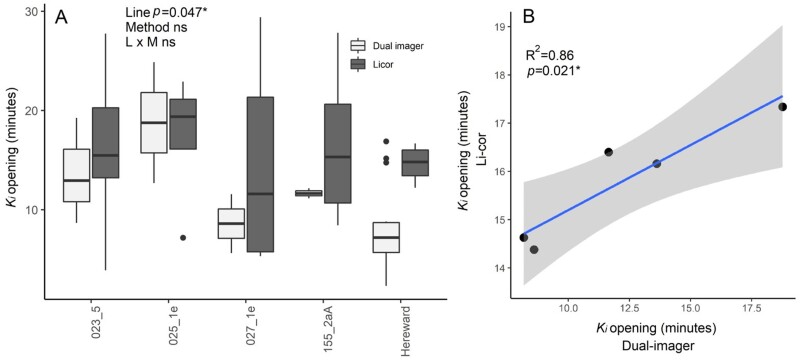
Fig. 1.
Comparison of methods for the measurement of stomatal opening. (A) Time constant for stomatal opening analysed via an infrared gas analyser (dark grey) and the dual imager (light grey) (n=3–7) in a subset of wheat genotypes. Data were analysed with two-way ANOVA and significant differences are indicated. (B) The linear association between the two methods. Data are means, and fitting was carried out via linear regression.

